
The article from Corelan Team explains the fundamentals of debugging with WinDbg and WinDbgX, focusing on how security researchers and reverse engineers can analyze Windows applications during runtime. It introduces the debugger architecture, explains the difference between the classic WinDbg and the newer WinDbgX interface, and describes how to attach to processes, launch applications under a debugger, and control execution flow. The guide walks through essential debugging concepts such as breakpoints, stepping through code, inspecting registers, viewing memory, and analyzing call stacks. It also demonstrates how symbols work and why correct symbol configuration is crucial for meaningful debugging results. Practical command examples show how to navigate disassembly, examine variables, and understand program behavior when investigating crashes or vulnerabilities. The article is designed as an introductory foundation for exploit developers, malware analysts, and reverse engineers who need to understand Windows debugging before moving on to more advanced exploitation techniques and vulnerability analysis.
Introduction
Is AI an evolution or a revolution? Or both? Those are interesting questions.
Speaking of AI – even ChatGPT and Grok agree: A debugger is the one of the most (if not the most) important tool for exploit developers, malware analysts, and reverse engineers. Exploit development, malware analysis and reverse engineering all ultimately share certain core activities, including figuring out and observing what a process does at runtime.
A debugger is the tool that facilitates that. It’s like turning an application into a fish bowl, giving you some sort of control over the fish as well:
- Exploit developers tend to look at memory corruptions, look at the state of registers, memory contents and layouts. They search for certain instructions, gadgets, primitives and essentially build an exploit step by step, using the debugger as their companion.
- Malware analysts may use a debugger to unpack malware, bypass anti-analysis tricks, dump content from memory, and so on.
- Reverse engineers use debuggers to follow execution paths, understand logic, confirm static analysis hypotheses. It tells you what actually happens.
(Of course, tools such as Ghidra, IDA Pro and Binary Ninja play an important role in the world of malware analysis, reverse engineering and exploit development as well, but I’ll stick to the debugger for now.)
Debuggers are powerful utilities, because they allow us to see what is going on, they allow us to intervene, inspect registers, memory and execution state, and basically slow down the execution of an application all the way to a single-CPU-instruction-level. Once you have a debugger connected to an application, far fewer things remain invisible. There might still be obfuscation and anti-debugging or other things that can make your life difficult. But at least you’re closer to seeing what happens under the hood.
Unlike what some people believe, a debugger is not an application that is inserted between the CPU and the application, and it’s not a proxy.
A debugger is typically a separate process that interacts with the OS debugging subsystem, which delivers debug events and allows the debugger to influence execution of the target process.
An application runs because its threads are scheduled by the kernel to execute on the CPU.
Under normal circumstances, execution proceeds uninterrupted. However, when certain events occur—such as exceptions, breakpoints, or thread creation—the kernel generates debug events.
If a debugger is attached to the process, these events are delivered to the debugger instead of being handled immediately by the application. The debugger can then inspect the process state (registers, memory, stack) and decide how execution should continue.
In this model, the debugger does not sit between the application and the CPU. Execution still happens natively on the processor. The debugger operates by reacting to events and controlling execution through the operating system.
A debugger gives you two core capabilities: visibility (seeing state) and control (influencing execution). Everything else builds on that.
Anyway, the more fluent you become at operating a debugger, the closer you’ll get to thinking in the language of the machine, and the easier (crash) analysis, debugging, vulnerability research and exploit development process will become.
In today’s post, I’m going to walk you through the basics of using Microsoft’s free debugger: WinDBG (Classic) and WinDBGX. We’re basically going to learn how to use the Debugger. We’ll cover how to install and configure them and how to perform basic elementary tasks using a simple demo application. In later posts, we’ll go over some more advanced features, basically learning how to make the Debugger work for us.
Maybe you got here because you’re preparing to take a Corelan class. Or maybe you’re here because you’re just learning stuff on your own. Whatever it may be, welcome! We’ll take this slowly, one step at a time.
If you have any questions, feel free to join our Discord server and reach out.
Why WinDBG?
WinDBG(X) is not the only debugger out there, and it’s not necessarily the best one.
Its default GUI is rather “basic”, and if you’re new to the craft, you may end up fighting the debugger as well as the application/memory corruption.
WinDbg is powerful, but it does have a learning curve, and out of the box it may not be the easiest debugger for beginners.
Nevertheless, it does have a few interesting features that make the learning curve worth while:
- It has extensions/plugins that will assist with examining the Windows heap, amongst others.
- It has powerful scripting and automation capabilities
- It has the ability to open crash dump files
- You can use it to debug the Windows Kernel as well as applications
- It has native support for symbols. (I’ll explain what symbols are in a moment).
- Through its symbol support and availability of extensions, it provides insight in certain Windows internals.
- WinDBGX, the newer version of WinDBG, has a neat feature called Time Travel Debugging (TTD), which records execution of an application and it allows you to step backwards in time. For complex bugs and root cause analysis, this can be pretty powerful.
Symbols?
Symbols are generated during the build process (typically at link time). A symbol file (with extension .pdb) contains human-readable elements from the source code, mapped to addresses and structures in the compiled binary. For example: function names, variable names, data types, and so on.
There are 2 main types: ‘Public’ and ‘Private’ Symbols. Private symbols provide more details than public symbols (for instance, local variable names).
Symbols are not required to run the application, but it is very useful to have when you are debugging an application.
When you have the source code of an application, it makes sense to generate the corresponding symbols yourself. If WinDBG is able to locate the matching .pdb file (for example, because it’s found in the same folder, or it is retrieved via the symbol path configuration), it will automatically parse it, giving you names (of functions etc) as opposed to numbers/addresses.
Microsoft decided to release (public) symbols for some of its software, including the Operating System itself, Office Products, web browser, etc.
(And some other developers did the same – Mozilla, Chromium, etc).
If you’re a bit familiar with Visual Studio, you may have noticed already that a symbol .pdb file is created automatically for Visual C++ projects. You can find the debug information options in the project properties, under the “Linker” – “Debugging” settings. The default setting is /DEBUG, but you can change it to /DEBUG:FASTLINK and /DEBUG:FULL. The latter will create full (or ‘private’) symbols.
Installing WinDBG Classic and WinDBGX
I’m going to use a Windows 11 Virtual Machine, but you can use Windows 10 as well.
WinDBG Classic has versions that work on older Windows versions as well, the newer WinDBGX debugger only runs on newer Windows versions. (Win10 and up).
Why do we need both?
WinDBG Classic does not get updated automatically, WinDBGX is under active development.
That’s great, but I have noticed that some updates introduce features or change behaviour of existing commands.
Some of the commands I rely on in WinDBG Classic no longer work in WinDBGX. Likewise, there are features in WinDBGX that simply don’t exist in Classic WinDBG.
That’s why I usually install and use both on my research virtual machines. I basically switch back and forth based on the task I’m trying to do. I know that WinDBG Classic will behave consistently (because it won’t get updated mid-session)
At the same time, it means it may have outdated logic.
Luckily, we can run both debuggers on the same machine. They’re fundamentally different applications and don’t overwrite one another. That said, I don’t think it’s a good idea to connect both of them to the same application at the same time.
If you would like to have a debugger for certain tasks, and you want some other tool to monitor or trace things, then you may want to consider a instrumentation platform such as Frida.
Anyway, I digress, maybe I’ll talk a bit about Frida in another post.
let’s start by installing both WinDBG Classic and WinDBGX on our system.
Scripted/automated installation
Students that are taking one of the Corelan classes are requested to bring a few Virtual Machines that contains some applications and configurations. In order to streamline the installation & configuration process, I decided to create a PowerShell script that will download and install most of the required components, including WinDBG Classic and WinDBGX. The script includes installers for other components as well, such as Python, Visual Studio Express Edition, etc.
If you’re a fan of automation and don’t mind installing those other components as well (or if you are preparing for class), feel free to open our CorelanTraining repository on GitHub and download CorelanVMInstall.ps1 to your system.
Next, open a PowerShell Terminal, with administrator privileges:
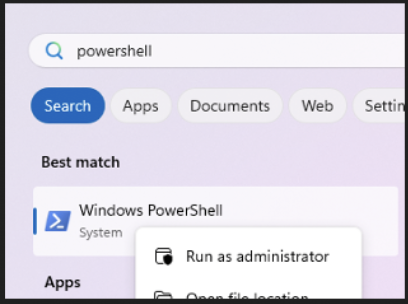
- Click on the “Start” icon, start typing powershell. The “Best match” section should show “Windows PowerShell”.
- Right click “Windows PowerShell” and choose “Run as administrator”
In the administrator PowerShell Terminal, first run the following statement to allow the downloaded PowerShell script to execute:
Set-ExecutionPolicy RemoteSigned(if that doesn’t work, you may have to open it even further)
Set-ExecutionPolicy UnrestrictedNext, just to be sure, verify that your VM has a working internet connection.
Also, please make sure your laptop is connected to a power supply, and is not installing Windows updates or any other software installers at this point.
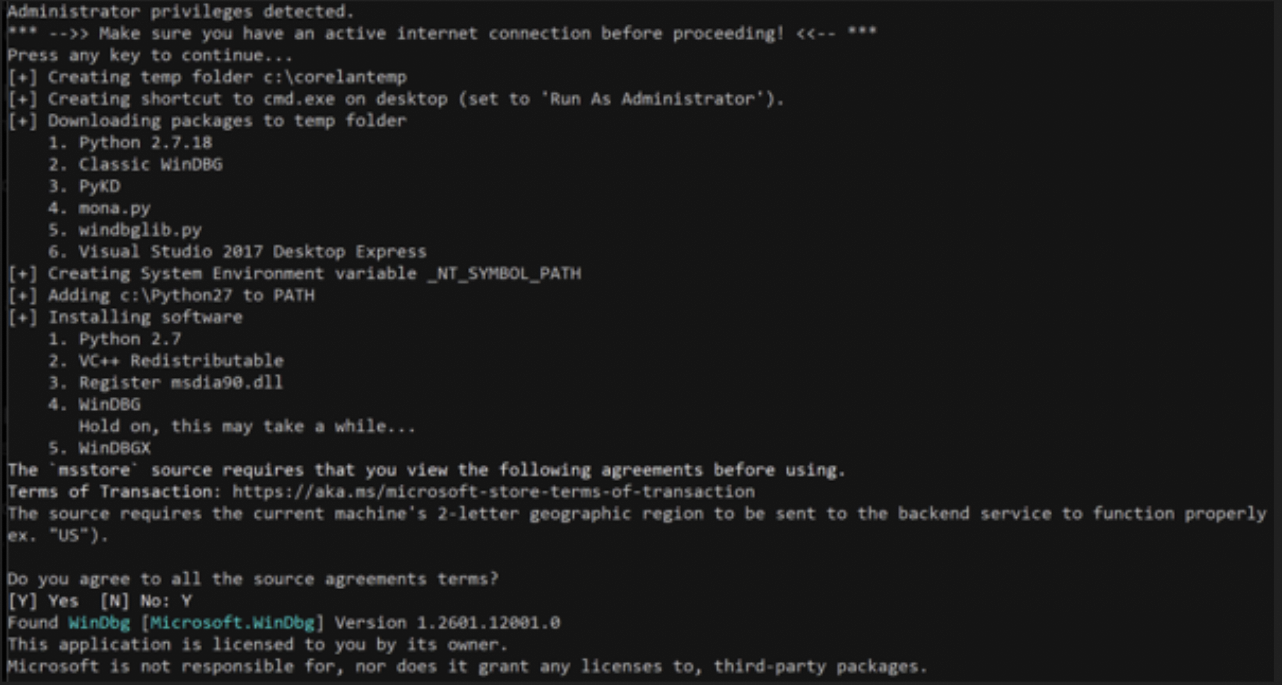
In the administrator PowerShell Terminal, navigate to the folder that contains the downloaded PowerShell script, run the script and lean back:
.\CorelanVMInstall.ps1The script will download and run various installers (including WinDBG Classic and WinDBGX). The last application in the list will be Visual Studio Express Edition. This step requires a bit of manual user interaction (such as clicking “Continue” and “Install”). The Visual Studio Express Edition installer will download a few Gigabytes of components, so please be patient.
Finally, check the output of the CorelanVMInstall.ps1 script for errors and, after verifying that everything looks ok, reboot your VM.
Wait for Windows updates to install (if needed).
You’re all set, you can continue with “Verify if both versions work”
Of course, if you prefer to just install WinDBG Classic and WinDBGX by hand, following the steps below:
Manual Installation
Classic WinDBG
- Download the Windows 10 SDK from https://developer.microsoft.com/windows/downloads/windows-10-sdk. (version 10.0.183621 is known to work well)
- Launch the installer with administrator privileges (right-click on the file and choose ‘Run as administrator’)
- During installation, only select “Debugging tools for Windows”. Deselect the other options
- Install in the default path. (C:\Program Files (x86)\Windows Kits\10\Debuggers\…)
WinDBGX
- Open a PowerShell terminal with administrator privileges
- Run the following command
winget install Microsoft.WinDbg --silent --accept-package-agreementsOnce installed, you can check for updates via the following command:
winget upgrade Microsoft.WinDbgMicrosoft Symbol Server
Since we’re working on Windows, we’ll go ahead and already configure our system to connect to Microsoft’s Symbol Server, which contains the .pdb files for Operating System components, Office Products, etc.
There are a few ways to configure WinDBG(X) to connect to the right server, but I prefer to use the following system-wide configuration.
From an administrator command prompt, run the following command:
setx /m _NT_SYMBOL_PATH "srv*c:\symbols*https://msdl.microsoft.com/download/symbols"This will create a Systemwide environment variable _NT_SYMBOL_PATH
Its value is then set to “srv*c:\symbols*https://msdl.microsoft.com/download/symbols”.
WinDBG(X) and other applications that rely on the same system environment variable, will now connect to Microsofts Symbol Server, and download relevant .pdb files to folders inside c:\symbols.
(Of course, feel free to change the local folder/ path as you wish. WinDBG(X) will create the folder if needed).
From this point forward, make sure your machine has an active internet connection, as that is required to download symbols from Microsoft’s Symbol Server.
Verify if both versions work
Open an administrator command prompt and navigate to the folder that contains the WinDBG Classic installation:
c:
cd "C:\Program Files (x86)\Windows Kits\10\Debuggers"
Inside that folder, you’ll find a bunch of folders, including some folders that correspond with the 4 architectures that are supported by WinDBG Classic: x86, x64, arm and arm64
Let’s run the version for 32-bit. Enter the x86 folder and run the windbg.exe in that folder
C:\Program Files (x86)\Windows Kits\10\Debuggers>cd x86

C:\Program Files (x86)\Windows Kits\10\Debuggers\x86>windbg.exe
I’ll refer to this folder as the “WinDBG Program Folder” from this point forward.
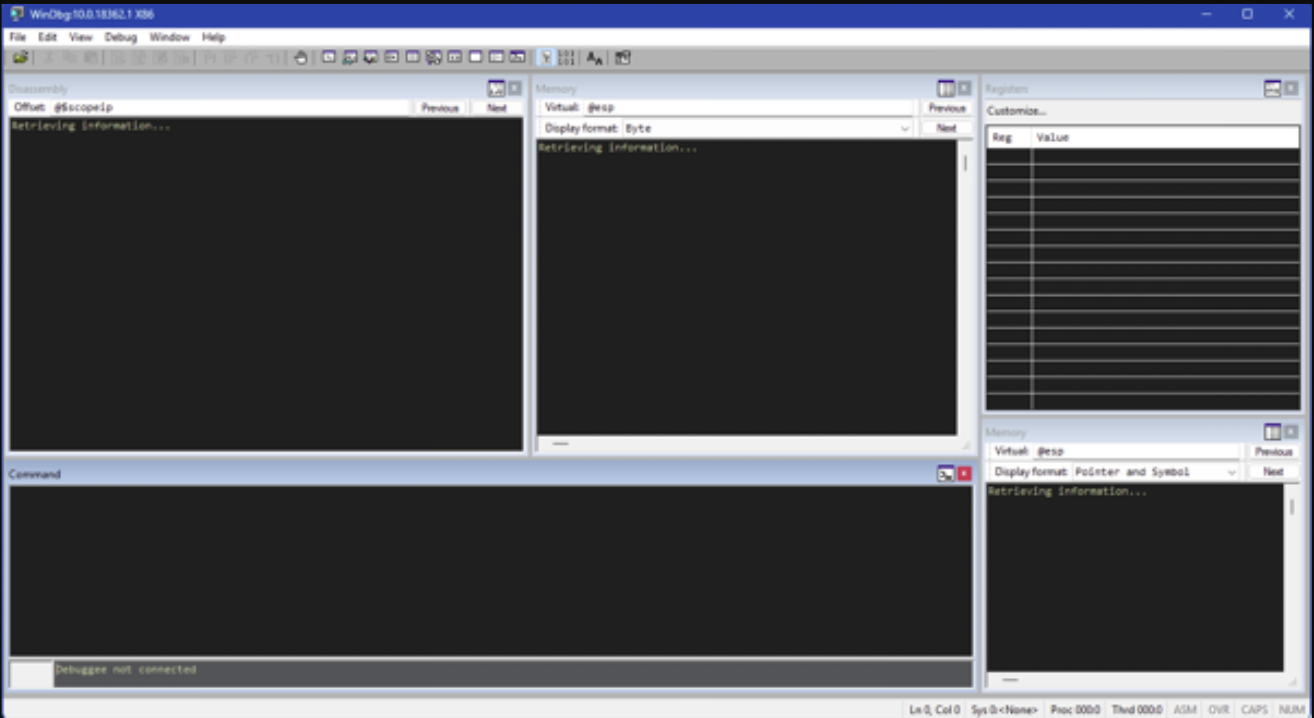
If all goes well, you should see something like this:
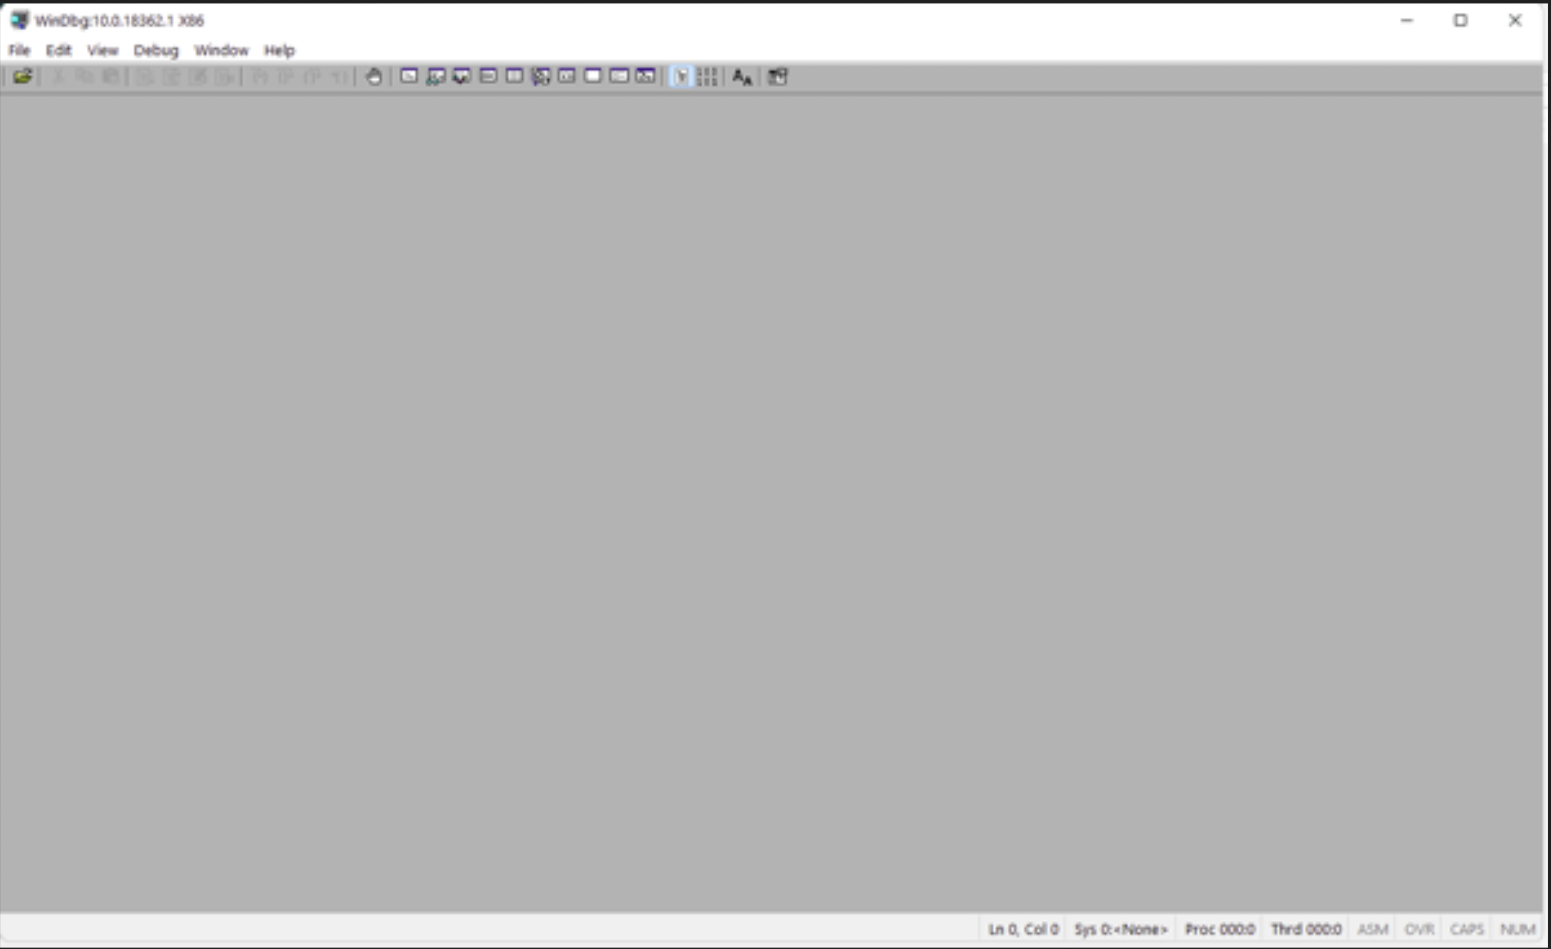
Great! The GUI itself feels a bit “empty”, but at least WinDBG is running.
Please take note of the fact that WinDBG Classic has a separate executable for each architecture. Make sure to run the binary that matches with the architecture of the application you’re going to work with
Close WinDBG.
From the same command prompt, run windbgx.exe (just add an ‘x’ after ‘windbg’).
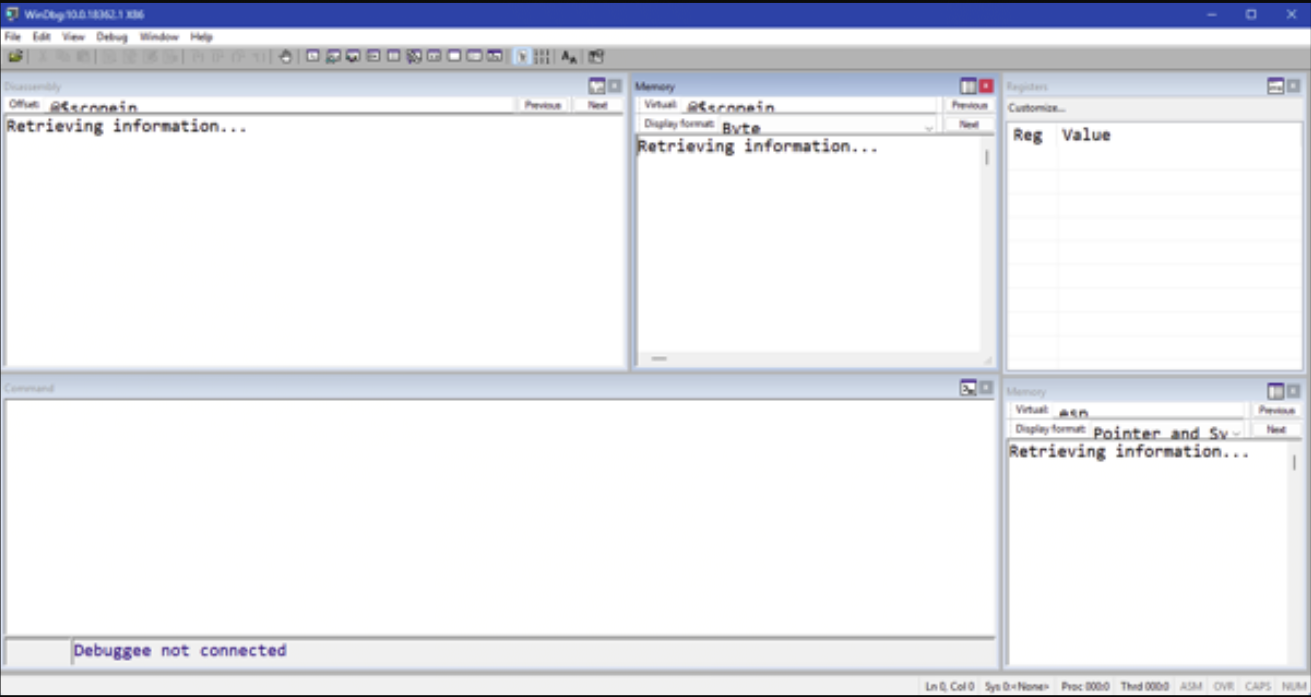
C:\Program Files (x86)\Windows Kits\10\Debuggers\x86>windbgx.exeAlthough WinDBGX is installed inside its own folder structures, you can actually launch it from any location. If WinDBGX was installed correctly, you’ll see something like this:
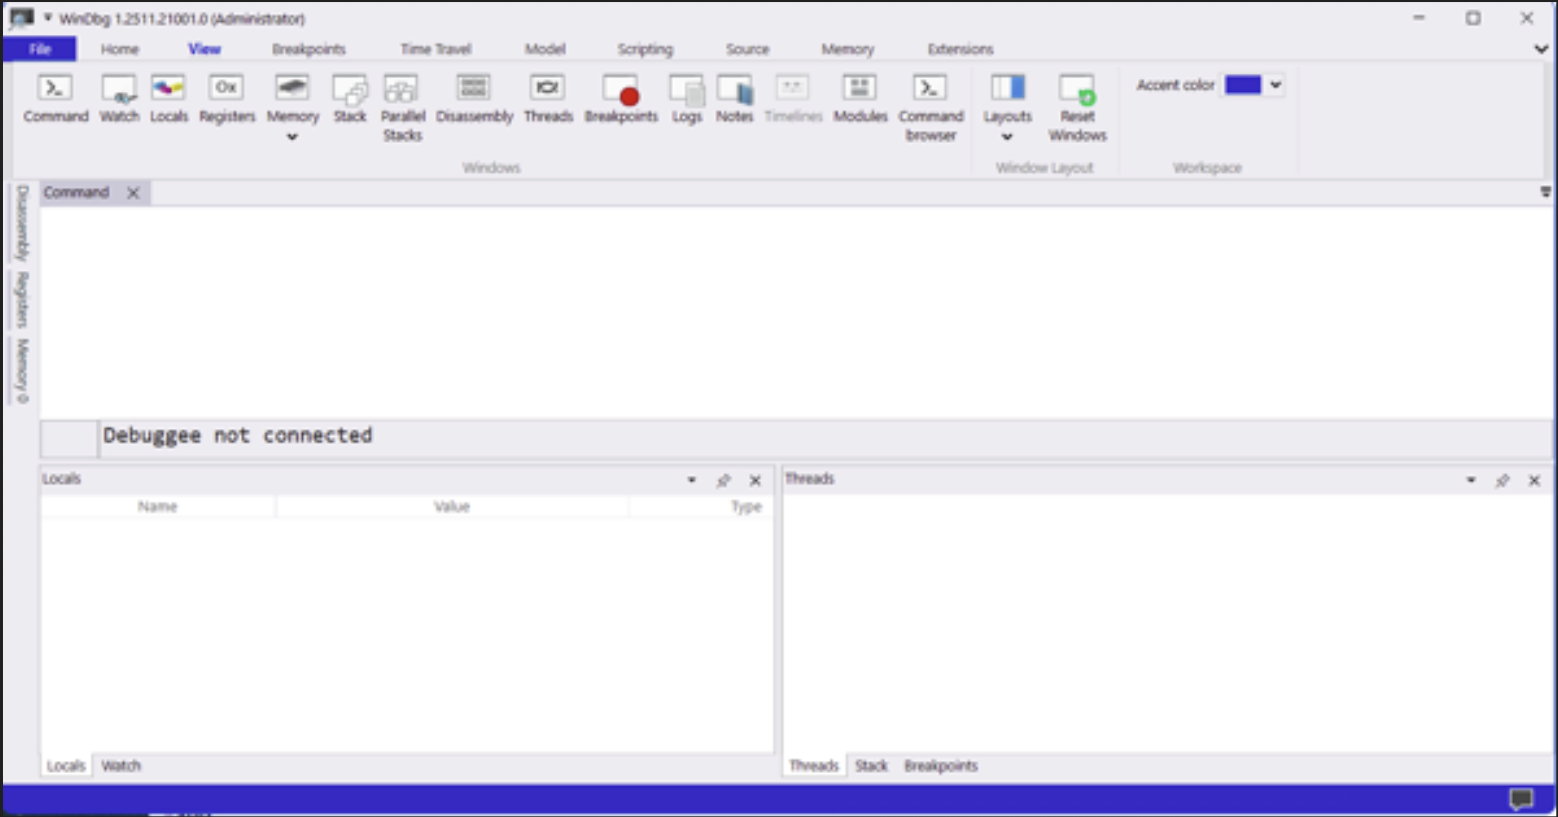
We see that the GUI has a bigger ribbon bar and 3 panels. But it’s all still very empty.
Anyway, we now know how to launch WinDBG Classic and WinDBGX.
That’s great, but they won’t do much just running by themselves.
They’re designed to operate, attached to another process.
Let’s see what that looks like next.
Connecting to a process
There are a few ways to have a debugger connect itself to another process. The 2 most important techniques are:
- ‘Opening’ or ‘launching’ an executable. The debugger will then create that application, and it will be connected to it from the start, leaving it paused before it executes application logic.
- ‘Attaching’ to an already running process. In this case, it will “intervene” and pause the application, regardless of where it was/is.
Both can be done from within the debugger, as well as from the command line.
What is the difference between these 2 techniques, which one should you use, and how do we “open” and “attach” in WinDBG(X)?
Open executable vs Attach
Both techniques (‘opening/launching’ or ‘attaching’) ultimately rely on the use of the Windows debugging subsystem. A debugged process has a debug object associated with it. The process’ Kernel structure EPROCESS includes a DebugPort, which points to a DebugObject, etc. If non-null, it means the process is actively being debugged.
(Check out the Vergilius Project website for more information about this kind of Kernel Structures – f.i. this Windows 11 version of EPROCESS)
The Kernel has a few routines that are accessible via System calls:
NtCreateDebugObject, NtDebugActiveProcess, NtWaitForDebugEvent, NtDebugContinue
The Userland side of the Operating System has wrappers functions to use them.
If all of this is too much detail for you at this time, don’t worry. You don’t need to remember all of this to use the debugger. It’s just here FYI.
Nevertheless, there are still differences between ‘opening’ and executable and ‘attaching’ to a process, related with:
- The “initial break” – the place/moment during the execution of the application when the debugger is “attached” to the process, and takes control
- The effect to “Debug Flags”
Lets have a quick look at what these difference are:
Initial break:
Opening/Launching
When ‘opening/launching’ an executable, the process will be created from the start, with the debugger attached to it. You’re technically able to see everything from process creation, the initialization routines, TLS Callbacks, etc.
The process will be created with a special flag DEBUG_ONLY_THIS_PROCESS, telling the kernel to route all debug events to the debugger. I.e. the debugger has control right away. The debugger now enters a loop involving WaitForDebugEvent() and ContinueDebugEvent()
The process will be paused at the so-called “initial breakpoint”, which is triggered by the Windows Loader routines.
Attaching
When “attaching”, the debugger needs to connect itself to a process that already exists. Technically, there is an invasive and non-invasive way for a debugger to attach itself. By default, debuggers use the “invasive” method. It means that it uses DebugActiveProcess(pid), which is a routine that will call the NtDebugActiveProcess system call to:
- Associate the debugger with the debug port of that process
- Suspend all threads in the process
- Some synthetic debug events (simulating the events that the debugger would have received if it was attached from the start, so it can catch up with the environment)
- Finally, cause a break-in exception, so the debugger has control.
With an invasive attach, the debugger gets full debugging control, allowing you to:
- set breakpoints (INT3)
- single-step execution
- receive exceptions
- suspend/resume threads
- modify registers
- control execution flow
The DebugActiveProcess() technique involves creating a new thread inside the process, thus technically modifying it, and running code inside the process that performs the steps listed above. If you let the process continue running (after it paused initially), you’ll see that it “begins” by exiting/cleaning up the thread that it used to “attach” itself. In other words, don’t freak out if you see that a thread gets terminated. You didn’t break anything, it’s just cleaning up itself.
When attaching to a process, the “initial break” happens wherever the program currently is the moment of attach.
Attaching: invasive vs non-invasive
An invasive attach means that the debugger will become the process’s official debugger in the Windows debugging subsystem. Windows only allows one debugger to own the DebugPort of the process.
A non-invasive attach means the debugger does not register itself as the process debugger. Instead of using DebugActiveProcess(), it uses OpenProcess() – just like other tools would do when it wants to connect to a process and look/analyse things. You can watch, but you cannot set breakpoints, perform single-step execution, intercept exceptions or control execution. Because it’s not really acting as a “debugger”, but more as a “spectator”, it’s not often used. In fact, not all debuggers support the non-invasive attach to begin with.
Debug Flags
Opening/Launching
When you open/launch an executable in the debugger, the debugger will automatically (and without telling you) activate a certain flag, a value that is part of a broader set of ‘Global flags’ (NTGlobalFlag) that, amongst others, affect how the Windows heap manager operates.
When the Debugger does this, it basically updates a field in the Process Environment Block (PEB).
Technically, you could also set GlobalFlags up front by creating a GlobalFlag key with a value that corresponds with the flag(s) that you wish to activate.
Let’s say you’re working with an application called corelanapp1.exe, then you’d have to set the following key:
HKLM\SOFTWARE\Microsoft\Windows NT\CurrentVersion\Image File Execution Options\corelanapp1.exe\GlobalFlag
That registry will affect any new instance of the corelanapp1.exe process, regardless of whether you’re opening it in the debugger or running it outside a debugger. The key persists across reboots, so be careful when you make this type of changes.
Anyway, when you open an executable in WinDBG Classic, it activates the following 3 flags:
- FLG_HEAP_ENABLE_TAIL_CHECK (0x10)
- FLG_HEAP_ENABLE_FREE_CHECK (0x20)
- FLG_HEAP_VALIDATE_PARAMETERS (0x40)
The values get summed up, so if the GlobalFlag indicates 0x70, it means those 3 options are active.
Some popular GlobalFlag options include:
Flag								Value		Description
FLG_HEAP_ENABLE_TAIL_CHECK			0x10		Detect overwrite past allocation
FLG_HEAP_ENABLE_FREE_CHECK			0x20		Detect use-after-free
FLG_HEAP_VALIDATE_PARAMETERS		0x40		Validate heap calls
FLG_HEAP_VALIDATE_ALL				0x80		Aggressive heap validation
FLG_APPLICATION_VERIFIER			0x100		Enables AppVerifier
FLG_HEAP_PAGE_ALLOCS				0x02000000	Full page heap
Note: WinDBG doesn’t create the registry key, it just updates the NtGlobalFlag field in the PEB directly.
‘Opening’ an executable in a debugger also activates certain flags in the PEB that make it obvious that the process runs with a debugger attached to it.
Both features (heap and debug flags) may affect your debugging session:
- It would be trivial for anti-debugging logic to detect that the application is being debugged.
- Furthermore, key core features in the heap will behave differently, changing sizes, layouts, relative distances etc. You’re essentially running in an environment that does not resemble reality, and you may end up building an exploit that is based on behaviour and calculations made in a ‘debugging’ context.
- Even if all of that doesn’t play a role for your exploit, the application developer may have taken the decision to take a different code path when it detects it is being debugged. For instance, it may print out debug information, and the fact that it runs additional or different code, may have an impact on when/where/how the application processes your input.
Long story short, running an executable in a debugger is not the same thing as running it outside a debugger.
We’ll look at an example in a moment, and I’ll also explain how to overrule this default behaviour at that time. Let’s look at the effect of “attaching” first.
Attaching
When attaching to a process, the process will use whatever Global Flags were present already (none by default). In other words, the application will behave just like it would without a debugger, because there was no debugger present at process creation.
From an anti-debugging perspective, the fact that some obvious flags won’t be present, doesn’t mean the application won’t be able to detect that it is being debugged. There are many anti-debugging and anti-anti-debugging techniques, but I rarely see those being used in commercial ‘productivity’ software. In my personal experience, these techniques are more frequently found present in malware and games.
Connecting to a process: exercises
Let’s do a few exercises to practice connecting a debugger to a process, either by opening it or by attaching.
Go to https://github.com/corelan/blogposts, open the “debugging” folder, then open the “corelanapp1” folder and download the corelanapp1.exe binary from inside the “Release” folder.
You can access the .exe file directly here
From the same folder, please download the corelanapp1.pdb file and store it next to the .exe file.
When running the application outside of a debugger, you’ll see something like this:
Welcome to CorelanApp1!
www.corelan.be
Alloc 1 : 0x00F6DE20
Alloc 2 : 0x00F72E28
The distance from Alloc 1 to Alloc 2 is 0x5008 bytes
The application will pause, waiting for you to press return, and then terminate.
The values printed after ‘Alloc 1’ and ‘Alloc 2’ may be different, that’s ok. Under normal circumstances (and unless the Heap manager had to take a different decision), the distance between Alloc 1 and Alloc 2 will be 0x5008 bytes. Remember that number.
Let’s see if we can connect WinDBG and WinDBGX to this sample application, by “opening” and “attaching”, both through the GUI and the command line.
WinDBG Classic, ‘Open executable’
Open an administrator command prompt and launch windbg classic from within the WinDBG Program Folder:
Microsoft Windows [Version 10.0.26200.7623]
(c) Microsoft Corporation. All rights reserved.

C:\Windows\System32>cd "C:\Program Files (x86)\Windows Kits\10\Debuggers\x86"
C:\Program Files (x86)\Windows Kits\10\Debuggers\x86>windbg.exe
From the menu, choose ‘File’ and then click ‘Open Executable’.
Navigate to the folder that contains the corelanapp1.exe binary:
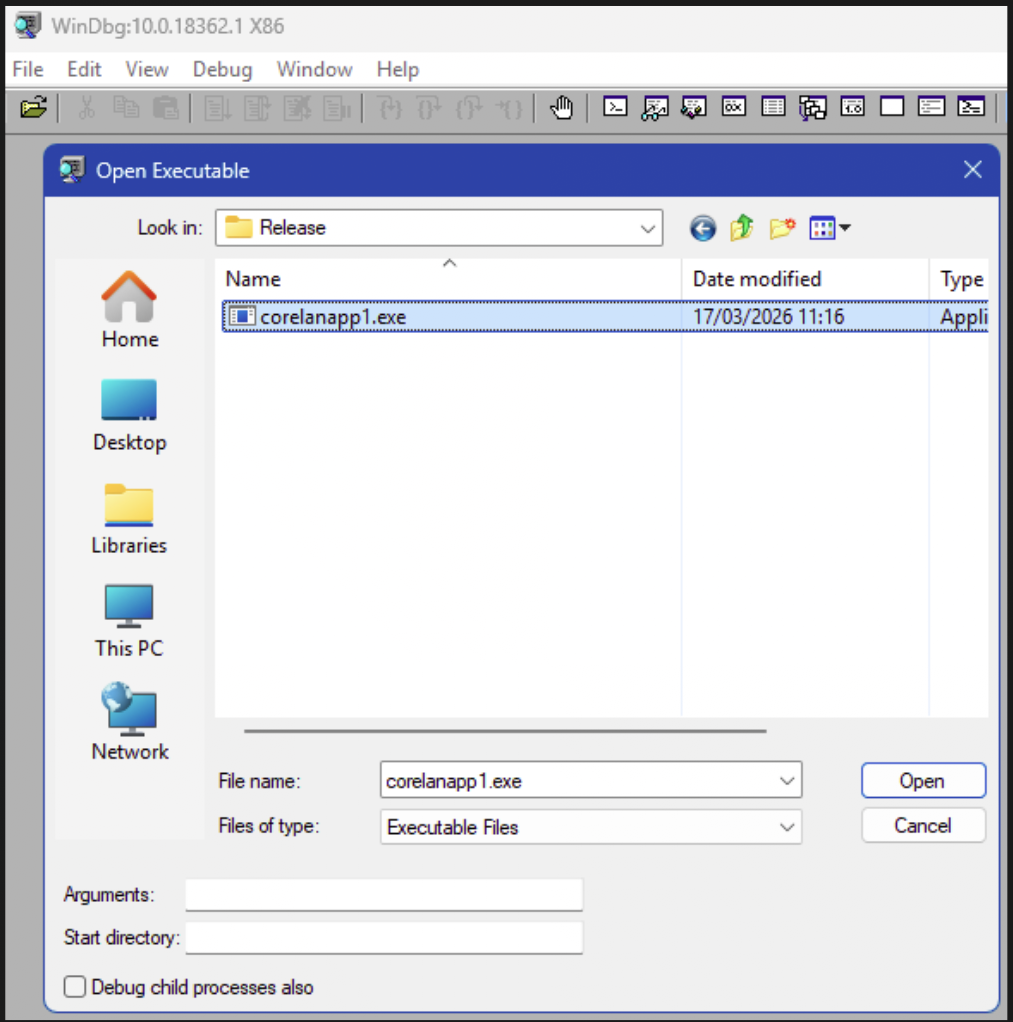
If the application would require command line argument(s), you can enter them in the “Arguments” field. (Not needed in this case).
Click ‘Open’ to start the debugging session.
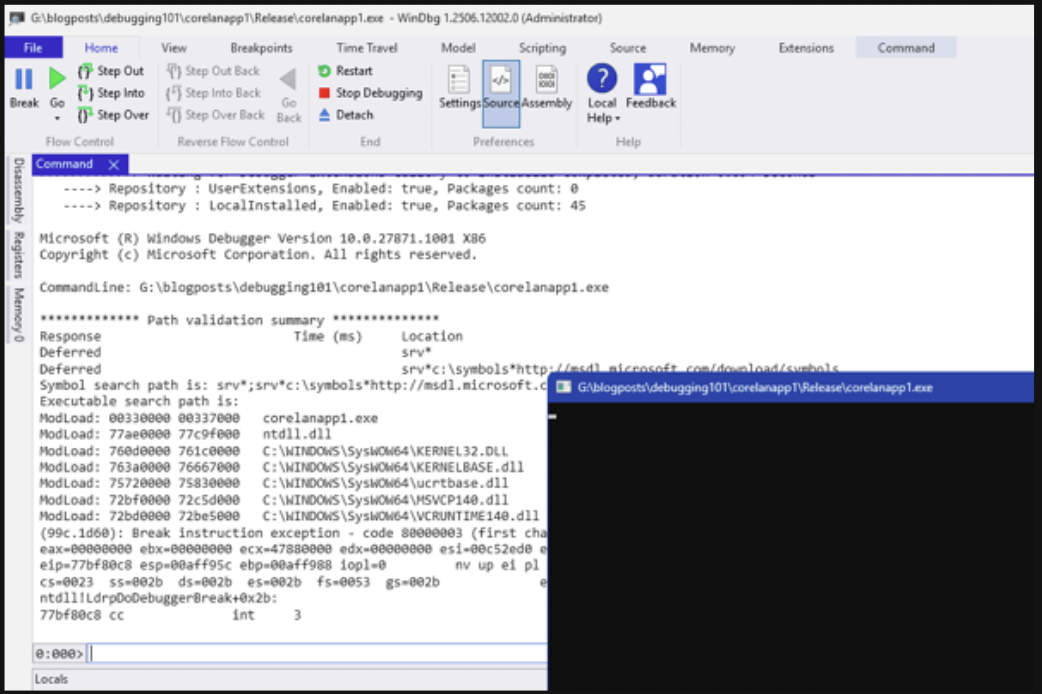
The process gets created, the WinDBG “Command” window appears and shows some text output
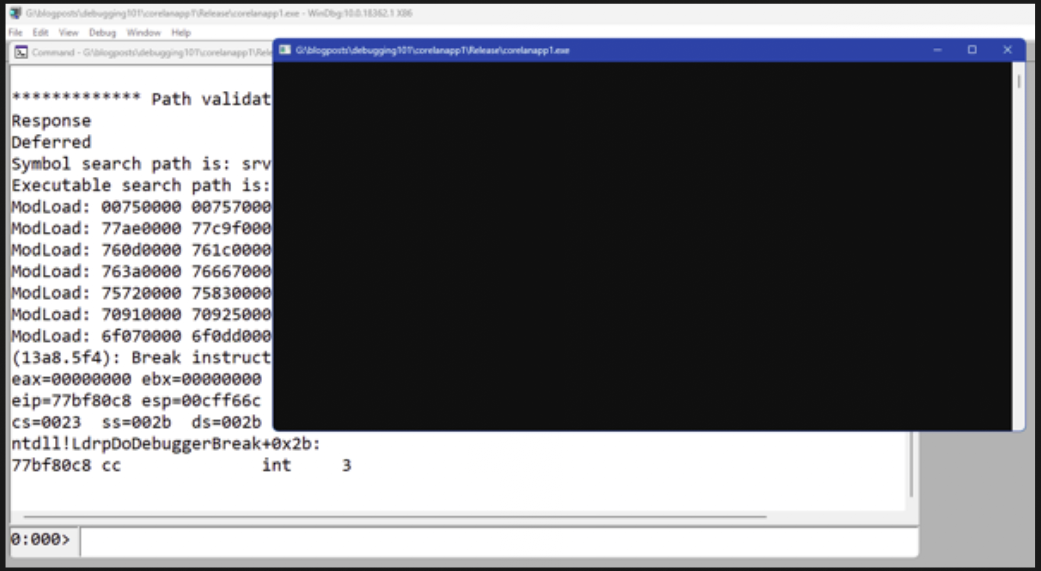
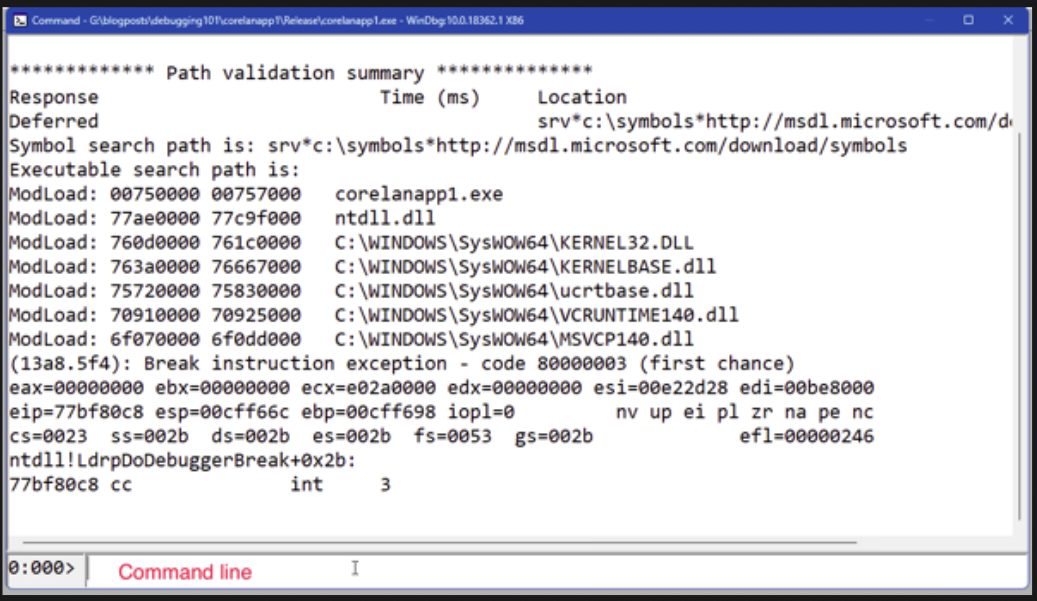
It is showing what modules (.exe and .dll) were loaded, it shows the state of registers, and it finally shows this:
(13a8.5f4): Break instruction exception - code 80000003 (first chance)
eax=00000000 ebx=00000000 ecx=e02a0000 edx=00000000 esi=00e22d28 edi=00be8000
eip=77bf80c8 esp=00cff66c ebp=00cff698 iopl=0         nv up ei pl zr na pe nc
cs=0023  ss=002b  ds=002b  es=002b  fs=0053  gs=002b             efl=00000246
ntdll!LdrpDoDebuggerBreak+0x2b:
77bf80c8 cc              int     3
Right below the “Command window”, we can see an input field. This is WinDBG’s Command line. It is enabled (i.e. we can enter text), which indicates that the process exists, the debugger is attached to it, but the application is not in an active running state. The debugger is now waiting for our input to do something.
In other words, when we open an executable in a debugger, it creates the process but – by default – it will end up in a paused state.
None of the application code has run at this point. We’re right at the end of the OS logic that creates the process, but before any of the application logic itself has executed.
We can now issue WinDBG commands, for instance to allow the process to continue running.
The command g (or shortkey F5) will do that.
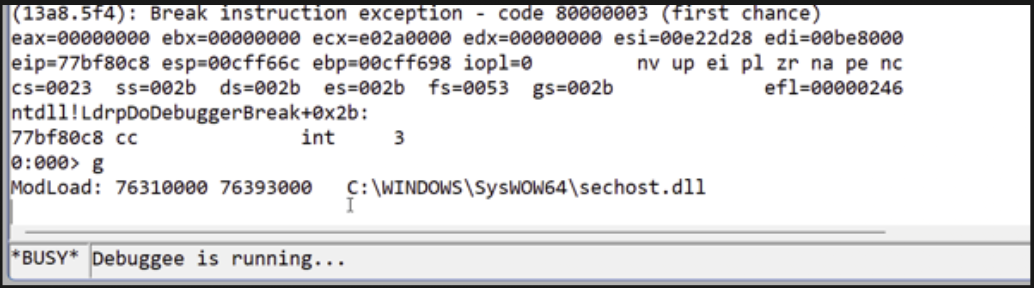
The command line indicates “Busy” and “Debuggee is running…” and we can no longer type commands. If we open the Window for corelanapp1.exe, we can see that it has executed code and is now waiting for a key press before it terminates.
For example:
Welcome to CorelanApp1!
www.corelan.be
Alloc 1 : 0x00C3D000
Alloc 2 : 0x00C42018
The distance from Alloc 1 to Alloc 2 is 0x5018 bytes
Note that the distance from Alloc 1 to Alloc 2 is now 0x5018 bytes instead of 0x5008. When we ran the application outside the debugger, it was showing a distance of 0x5008 bytes.
This is one of the effects of the NtGlobalFlags. The relative position of the heap allocations is different now. If you wouldn’t be aware of this, you might be building an exploit that is based on calculations made in a modified context.
Just like most command line statements, the “g” (F5) command works the same in both WinDBG Classic and WinDBGX
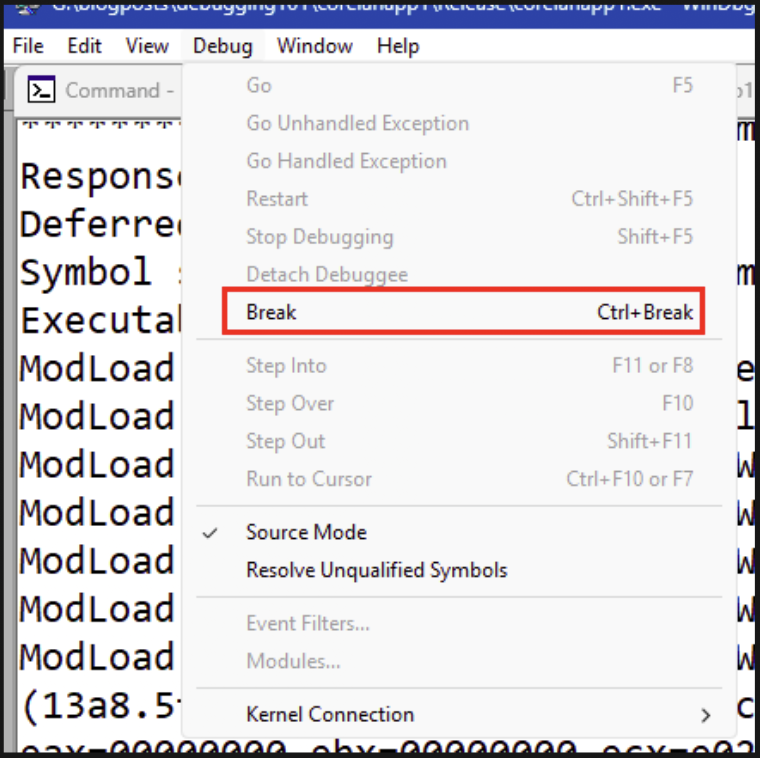
We can “break” the process (basically pause the application regardless of where it is) and give control back to the debugger by opening the “Debug” menu and choosing “Break”.
If you happen to have a “Break” button on your keyboard, you can also press the CTRL+Break combination.
Last but not least, we can also click the tiny little “pause” button in the toolbar:
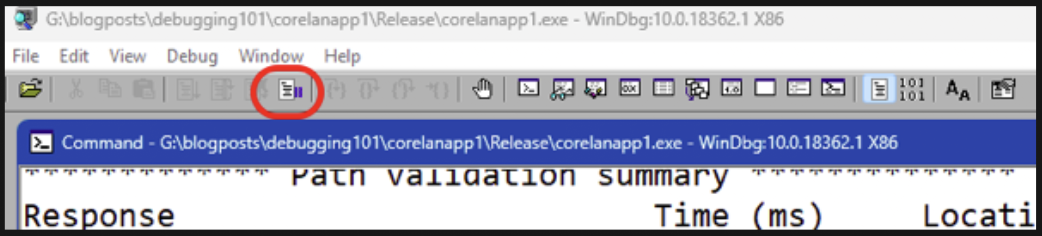
Regardless of the method you decided to use, it will trigger a “break” instruction, the process will pause and you’ll be able to issue WinDBG command line statements again.
(13a8.2370): Break instruction exception - code 80000003 (first chance)
eax=00a02000 ebx=00000000 ecx=77badcb0 edx=77badcb0 esi=77badcb0 edi=77badcb0
eip=77b5b400 esp=0113f964 ebp=0113f990 iopl=0         nv up ei pl zr na pe nc
cs=0023  ss=002b  ds=002b  es=002b  fs=0053  gs=002b             efl=00000246
ntdll!DbgBreakPoint:
77b5b400 cc              int     3
We can now invoke an extension that shows the NTGlobalFlag value for the current process. Running a plugin/extension requires an exclamation point followed by the extension name, in this case !gflag:
0:001> !gflag
Current NtGlobalFlag contents: 0x00000070
    htc - Enable heap tail checking
    hfc - Enable heap free checking
    hpc - Enable heap parameter checking
This confirms that some GlobalFlags have been activated. Not by us, but by the debugger.
As explained earlier, these flags are stored in the PEB. We have 2 ways to query the PEB for a process, either by using the !peb extension, or by asking WinDBG to dump the contents of memory at the location of the PEB and organizing the bytes based on its understanding of the PEB datastructure.
Here we can see the !peb extension at work. I truncated the output, but you should be able to see the contents of the NtGlobalFlag field:
0:001> !peb
PEB at 00be8000
    InheritedAddressSpace:    No
    ReadImageFileExecOptions: No
    BeingDebugged:            Yes
    ImageBaseAddress:         00750000
    NtGlobalFlag:             70
    NtGlobalFlag2:            0
    Ldr                       77c17340
    Ldr.Initialized:          Yes
    Ldr.InInitializationOrderModuleList: 00e244e8 . 00e37b28
    Ldr.InLoadOrderModuleList:           00e245f0 . 00e37b18
    Ldr.InMemoryOrderModuleList:         00e245f8 . 00e37b20
...
We can also perform a typed dump (dt) of the PEB using the following command:
dt nt!_PEB @$peb(The output will show that the NtGlobalFlag field sits at offset +0x68)
If we’re only interested in one specific field (for instance, the NtGlobalFlag), we can get its contents right away using the following command:
0:001> dt nt!_PEB @$peb NtGlobalFlag
ntdll!_PEB
   +0x068 NtGlobalFlag : 0x70
Finally, to terminate the WinDBG session (which will also terminate the process it is attached to), use the “q” command and press return.
The “Command” window will close, WinDBG itself will continue running. I do recommend closing it as well in between debugging sessions, as it may be caching some extension related stuff.
We can automate creating a process in WinDBG Classic from the command line as well. WindBG takes a bunch of command line options, one of which is the full path to the executable you’d wish to “open” in the debugger. You can also specify some command line flags to modify windbg behaviour, as well as command lines arguments to the binary you’re trying to run.
The basic syntax is
windbg.exe [windbg args] path/to/application.exe [app arguments]Let’s keep this simple for now, we’ll simply run windbg.exe, followed by the path to the corelanapp1 binary.
On my system, the corelanapp1.exe is stored under g:\blogposts\debugging\corelanapp1\Release,
Open an administrator command prompt, go to the folder that contains windbg.exe and run the following command
windbg.exe g:\blogposts\debugging\corelanapp1\Release\corelanapp1.exeThis will open WinDBG and then open the executable as if you have selected it from the “File” – “Open executable” menu option yourself.
The process is paused and you can now type commands at the WinDBG Command Line. For instance, if you run !gflag, you’ll see that the 3 NTGlobalFlags have been activated again.
You can execute “g” to let the process run, you can execute “q” to make it stop.
What if you don’t want the NtGlobalFlag to be set? There is a WinDBG command line flag -hd that allows you to overrule this behaviour, but it only works if you run windbg.exe from the command line and specify the application to run as well.
Running windbg.exe -hd without specifying the application .exe and then selecting it yourself from “File” – “Open executable” won’t actually turn off the NTGlobalFlags.
So, the correct syntax on my system would be
windbg.exe -hd g:\blogposts\debugging\corelanapp1\Release\corelanapp1.exeThe output of !gflag will now indicate that none of the flags were activated:
0:000> !gflag
Current NtGlobalFlag contents: 0x00000000
WinDBGX, ‘Launch executable’
With WinDBGX, Microsoft has made substantial changes to the end-user experience. The GUI now features a larger ribbon bar with easy-to-use buttons. The menu layout has changed as well.
To open an executable in WinDBGX (or to start a debugging session in general), we can simply click “File”. WinDBGX will automatically open the “Start debugging” submenu.
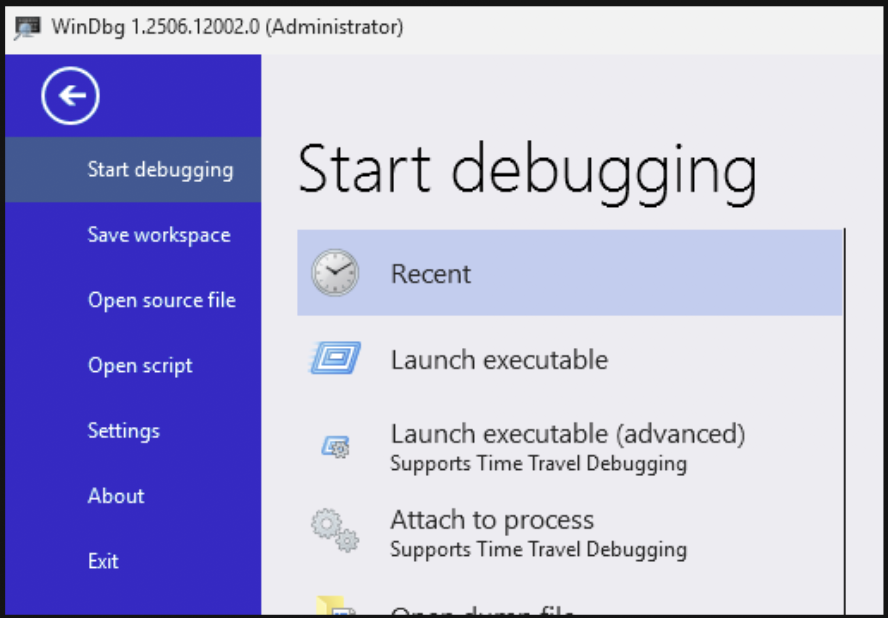
From the “Start debugging” submenu, we can now choose “Launch executable” or “Launch executable (advanced)”. With the former, you simply select the executable. With the latter, you get the option to specify command line arguments to the executable you’re trying to launch.
For the sake of this exercise, feel free to try both options. Select the corelanapp1.exe file and click “debug” to start the process with the debugger attached to it.
Although the GUI is slightly different, the basic principles still apply. The process is created but is paused, the Command window shows output, and we get the opportunity to issue commands using the WinDBGX Command Line input box. Similarly to WinDBG Classic, we can now type “g” and press return, or use F5 to let the process continue running.
Interrupting (breaking) a running process can be done by clicking the larger “Break” (pause) button at the left hand side of the “Home” tab of the ribbon.
Unlike WindBG Classic, WinDBGX only activates one NTGlobalFlag:
0:003> !gflag
Current NtGlobalFlag contents: 0x00000010
Current NtGlobalFlag2 contents: 0x00000000
    htc - Enable heap tail checking
We can launch the executable from the command line as well. The -hd flag serves its purpose as well, it allows us to overrule the debuggers default behaviour related with activating NTGlobalFlags.
windbgx.exe -hd g:\blogposts\debugging\corelanapp1\Release\corelanapp1.exeWinDBG Classic, ‘Attach’
I usually recommend my students to attach to an already running process (unless you won’t get the chance to attach to it without triggering a vulnerability).
This avoids having to consider NTGlobalFlags, and any initial anti-debugging checks may have passed already before your debugger is “invading” the process and attaching itself to it.
We can “attach” using the GUI, or using the command line (by either providing the process ID or the prooces name if there is only one process with the same name).
Attaching using the GUI works as follows:
- Start the application you’d like to debug
- Launch WinDBG
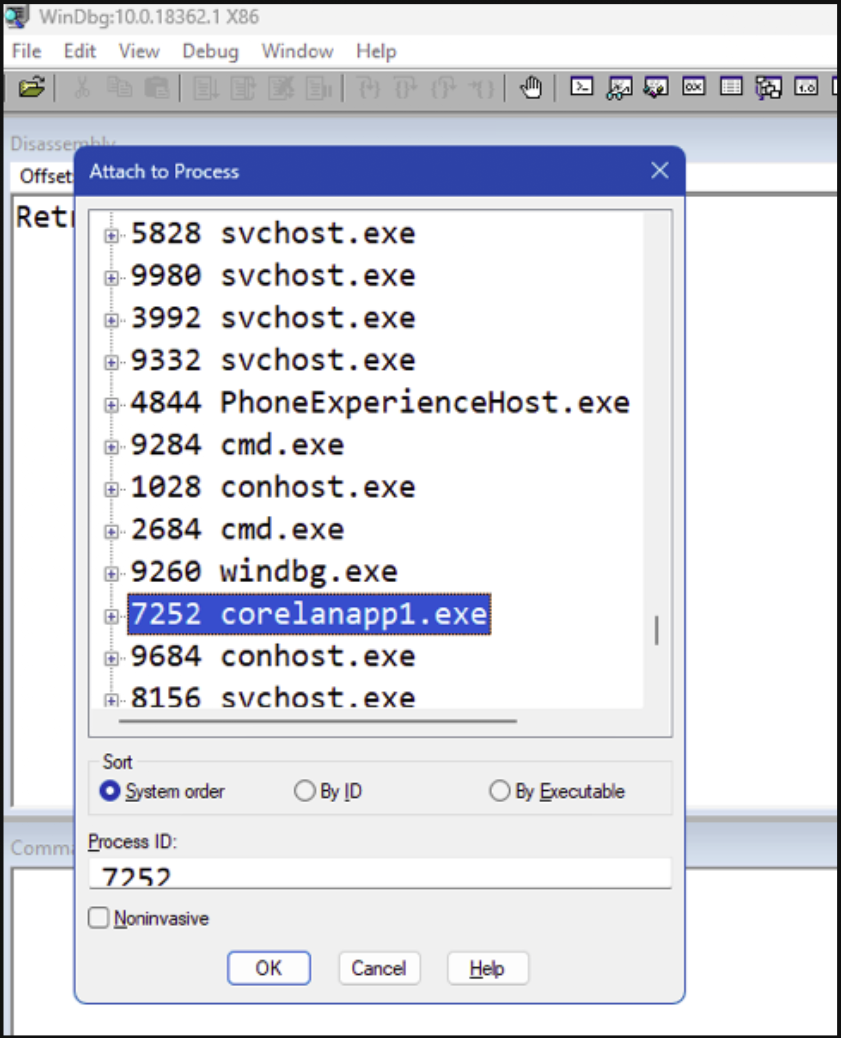
- Click “File” – “Attach to a process” or use F6
- WinDBG will show a list of processes, sorted in the order that they were created. (Old to new). This default sort order may be a bit annoying, because you’re quit likely going to attach to one of the last processes that was created, which means you’ll have to scroll down almost every time)
- Select the process you would like to debug. Note: WinDBG provides the ability to perform a non-invasive attach.
The Command window now appears, and the process will be paused. The debugger has created a new thread in the process and told it to run the required code for the debugger to be connected to the process, pause all the threads, and give the debugger control.
After attaching to a process, it will be paused (wherever it was executing code from).
From this point forward, everything works exactly the same as if you had opened the executable in the debugger. Of course, there won’t be NtGlobalFlags set by the debugger, but you can now interact with the process in the same way. You can let the process continue running with gor F5. You can break, you can look at memory contents, and so on.
Attaching to an already running process from the command line requires a bit of interaction first. You’ll have to either find the PID (process ID) of the process you’d like to attach to. If there is only one instance of the application running, then you may be able to attach to it using its process name as well.
Let’s say I launched corelanapp1.exe already, and there’s only one instance of an application running with that image name (corelanapp1.exe). I can use something like tasklist to get the PID:
tasklist /FI "IMAGENAME eq corelanapp1.exe"

Image Name                     PID Session Name        Session#    Mem Usage
========================= ======== ================ =========== ============
corelanapp1.exe              11016 Console                    1      5.132 K
And then I can attach WinDBG to it using the reported PID:
C:\Program Files (x86)\Windows Kits\10\Debuggers\x86>windbg.exe -p 11016Or, if there is only one process running with that image name, I can tell WinDBG to connect to it:
First, let’s confirm there is only one:
tasklist /FI "IMAGENAME eq corelanapp1.exe"

Image Name                     PID Session Name        Session#    Mem Usage
========================= ======== ================ =========== ============
corelanapp1.exe              11016 Console                    1      5.156 K
and then connect to it:
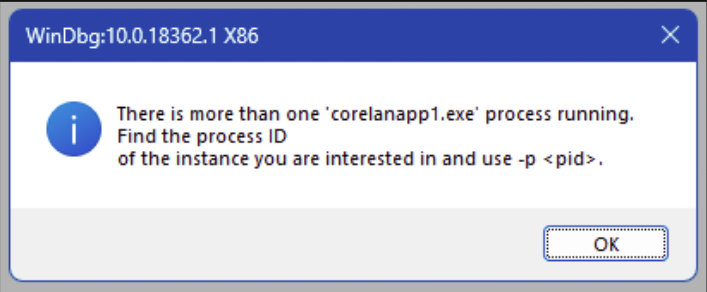
C:\Program Files (x86)\Windows Kits\10\Debuggers\x86>windbg.exe -pn corelanapp1.exeIf there was more than one process with this process name, you’d get something like this:
WinDBGX, ‘Attach’
In WinDBGX, attaching to an already running process can be done by clicking the “File” menu and then choosing “Attach to process”, or by simply pressing F6 (just like WinDBG Classic).
WinDBGX lists the processes in the order that they are created, but with the newest on top. In other words, you usually won’t have to scroll down to find the application that you just launched.
Select the process from the list, and click “Attach” to start the debugging session.
Attaching from the command line can be done using the same CLI arguments:
-p and -pn
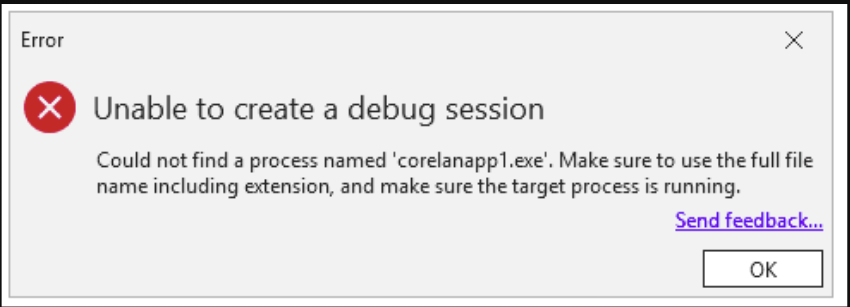
Interestingly enough, if you’re trying to attach to a processname that isn’t unique, the resulting error message in WinDBGX won’t be as clear as the one we got earlier in WinDBG Classic:
Running WinDBG(X) – Command Line Arguments
We’ve used WinDBG to open an executable and to attach to a process using the -p flag. I’ve demonstrated how to use the -hd flag to disable activating the NTGlobalFlags.
Those are just a few of the available command line options. Of course, you can find the full list of available options in the WinDBG Help, but I’ll take a moment to discuss the ones I use the most:
- -g → Do not break on initial execution. This flag allows you to automatically run the process once the debugger attaches or creates the process. It’s useful when scripting
- -G → Exit WinDBG when the process terminates. Similar to -g, it’s a useful CLI option when scripting
- -Q → WinDBG Classic only – Do not ask to save the workspace. Similar to -g and -G, it’s a useful CLI option when scripting
- -o → Follow child processes
- -logo path/to/logfile → Write the output of the entire debugging session into a log file
- -xd sov → Ignore “StackOverflow” exceptions
- -xi eh → Ignore C++ EH exceptions
- -WF path/to/workspacefile → WinDBG Classic only – make WinDBG load a “workspace” file, which allows you to customize the GUI. We’ll talk more about this in the next chapter
- -c “windbg commands”: Execute the commands (semi-colon separated) between the double quotes the moment the debugger breaks. You can use this to either execute commands at WinDBG startup (and by adding ;g at the end, WinDBG will mimic what command line option -g does.) Or you can use it in combination with -g to have WinDBG run certain commands when the debugging session stops (which is typically when it hits an access violation.
Customizing the GUI
Customizing the WinDBG Classic GUI
The WinDBG Classic Workspace
WinDBG Classic’s GUI is a bit … basic. You’ll get to see text based output in Command Window and you’ll need to instruct WinDBG to show you what you want to see.
People coming from visual debuggers such as x64dbg, Immunity, etc might feel a bit frustrated by the lack of visuals. People new to exploit development may not know yet what to look for, so the lack of visuals is not exactly helping either.
We have the option to customize the look & feel. We can open some additional windows/views and arrange them in such a way that it feels more intuitive (for those that come from x64dbg/…), by kind of mimicking a layout that would be similar to the majority of visual debuggers.
That means, showing:
- A disassembly view, showing CPU instructions around EIP
- The general purpose registers
- The stack, showing pointers instead of bytes (little-endian)
- The output in the Command window
- An window that allows us to see any location in memory
The look&feel of WinDBG Classic is called a “Workspace”. It includes what windows are visible, their position, the font & font sizes, colors used for certain things, the process it is attached to, etc.
The active workspace can be stored in a workspace file, and we can tell WinDGB (from the GUI or via a CLI argument) to load a workspace from file.
Saving the workspace to a file requires a bit of attention. As explained, it contains the process it’s attached to. If you were to save the active workspace (i.e. save the workspace from your active debugging session) to a workspace file, and your session is attached to a process, that information will be included in the file. Consequently, WinDBG will automatically try to attach itself to the process in that workspace file next time you open the workspace file, yes even if you were already attached to another process.
That’s probably not what we want.
On the flipside, in order to see the effect of the changes that you’re making, it helps if WinDBG is actually attached to something.
In other words, right before saving a workspace to file, we should detach WinDBG from the process it is connected to and then save the workspace.
Or, alternatively, you can customize the workspace, save it to file, and use a second debugger to load the workspace, attach itself to a process and see what the updated workspace looks like. That’s what I usually do. That way, I won’t forget to detach, and I can still see the effect of the changes I made in real time using the second debugger instance. Make changes in the empty (non-connected) debugger, and use a real session on the side to see the effect.
Whatever scenario. you do, please be careful not to save the workspace when WinDBG is actively debugging a process.
I have included 2 workspace files in the GitHub repository. You can find them inside the workspace folder:
- dark.wew → A ‘dark’ theme workspace file that I found somewhere on the internet, and
- corelan.wew → A ‘light’ theme workspace file that I created myself.
Feel free to download both files and store them in your WinDBG Program Folder. We’ll discuss how to use them next.
Before we do that, please note that the concept of workspace files no longer plays a role in WinDBGX. It has become a lot easier to customize the GUI, and WinDBG automatically remembers the GUI you have created. And if you don’t like what you did, you can reset the Windows and start over.
Anyway, let’s begin in WinDBG Classic.
Loading a workspace file in WinDBG Classic
Let’s tell WinDBG to open a workspace file.
We can do this from the GUI and by using a CLI argument.
The latter is obviously the easiest solution, as it would be entirely scriptable.
In fact, whenever I set up an exploit dev/research machine, I usually create a batch file and store it inside the WinDBG Program Folder.
The batch file invokes windbg.exe with a number of CLI arguments (such as -hd as well as the -WF argument which will allow me to load a workspace file), and then feeds it any other arguments I am passing to the batch file, if any.
Students of one of the Corelan classes will find a w.bat file in their ‘Tools/Windbg’ folder. Blog readers can copy it from the code box below.
Let’s say we want windbg.exe to automatically open the dark.wew workspace file, the corresponding w.bat file would look like this:
@echo off
REM ==========================================
REM Run WinDBG with optional arguments
REM Corelan Stack / Heap Training
REM www.corelan-training.com
REM ==========================================

REM Define base command (adjust path to wew file as needed)
set "WINDBG_CMD=windbg.exe -hd -WF dark.wew"

%WINDBG_CMD% %*
If you now run w.bat from within the WinDBG Program folder, the GUI will look like this:
Doing the same thing, but opening the corelan.wew workspace, the GUI will show this:
Of course, since we’re not attached to a process yet, the actual windows are still empty. But at least we get to see a certain layout that goes beyond the “Command” window.
Both workspaces have a couple of views in common:
- The Disassembly view (Upper left). This will show the CPU instructions (bytes and corresponding assembly statements) and their positions in memory. By default, the view will show the instructions around register EIP/RIP
- A Memory View (Upper middle). This view allows you to look at any location in memory. You can change the Display format
- The registers (Upper right). This view shows the state of the registers. I’ll talk a bit more about this view later on, because I made a modification to the default settings.
- In the lower half, on the left we see the Command view showing. This is where we will see all kinds of output: Debugger messages, alerts, output of commands we run, etc.
- In the lower right, we see the stack for the current thread, organized to show the contents around esp/rsp; and displaying the contents in ‘Pointer + symbols’ format.
For most people, those are the most important views to work with on an ongoing basis. Of course, there are additional views you can add/open if you’d like.
If you were to run windbg.exe just by itself, you have the option to just load a Workspace file from the ‘File’ menu as well.
Choose the ‘Open Workspace in File’ option, and select the workspace file you’d like to use. You can do this before or after you’ve connected to a process, the result should be the same.
Creating a custom workspace file for WinDBG Classic
You can create your very own custom workspace from scratch. Of course, you could also load an existing workspace file and start modifying it. In any case, the idea is that you configure all windows, their position, layout, the font used, and font colors for the current debugging session.
You’d then detach from the process and – once detached – save the workspace to a file.
The elements that may need some customization are:
- The active windows/views: This involves opening the views that you need an drag/dropping them into the right position. You can find the available views by clicking on ‘View’ in the top menu.
- Fonts (and font sizes): this can be done via ‘View’ – ‘Font’. I kind of like the Consolas monospace font, and I usually use a size that makes the experience somewhat pleasant for your eyes.
- Colors: this is part of the Options (‘View’ – ‘Options’). In addition to configuring the Colors, this is also where you can configure some other behavioural aspects of WinDBG. You can check the options in the corelan.wew file to see how I tend to configure my WinDBG session.
When done, (and detached from any process), you can now use ‘File’ – ‘Save workspace to File’ to write the current settings to your very own .wew file.
Enjoy!
The Register view
I’d like to share a quick note about the Registers view. You can open the view by clicking ‘View’ and then choosing ‘Registers’. By default, it shows 2 columns: the register (Reg) and its value:
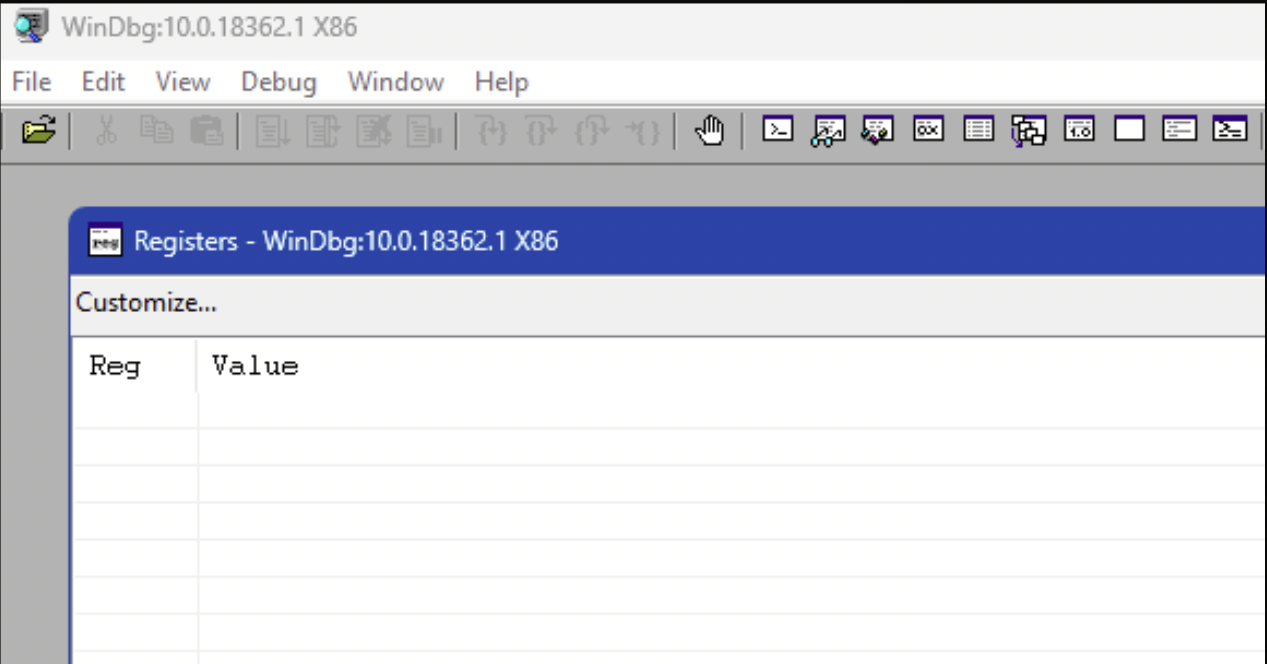
When attached to a process, you can click the Customize… button to see (and change) what registers you’d like to see (and in what order)
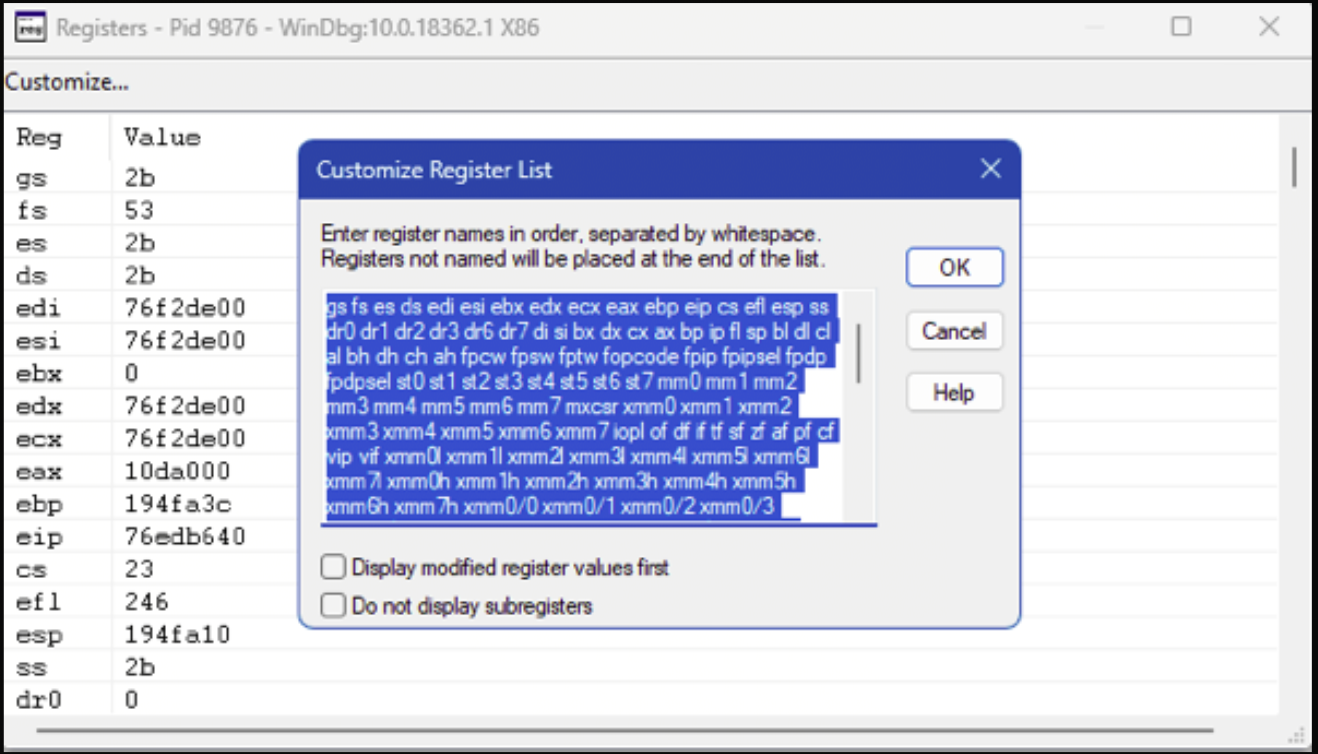
By default, WinDBG begins by showing a mix of segment registers and multi-purpose registers, in this order:
gs fs es ds edi esi ebx edx ecx eax ebp eip cs efl esp ssIt’s worth noting that CPU instructions such as PUSHAD and POPAD actually access the registers in a different order. In other to match their modus operandi with what I see, I prefer to change the order to this:
eax ecx edx ebx esp ebp esi edi eip gs fs es ds cs efl ss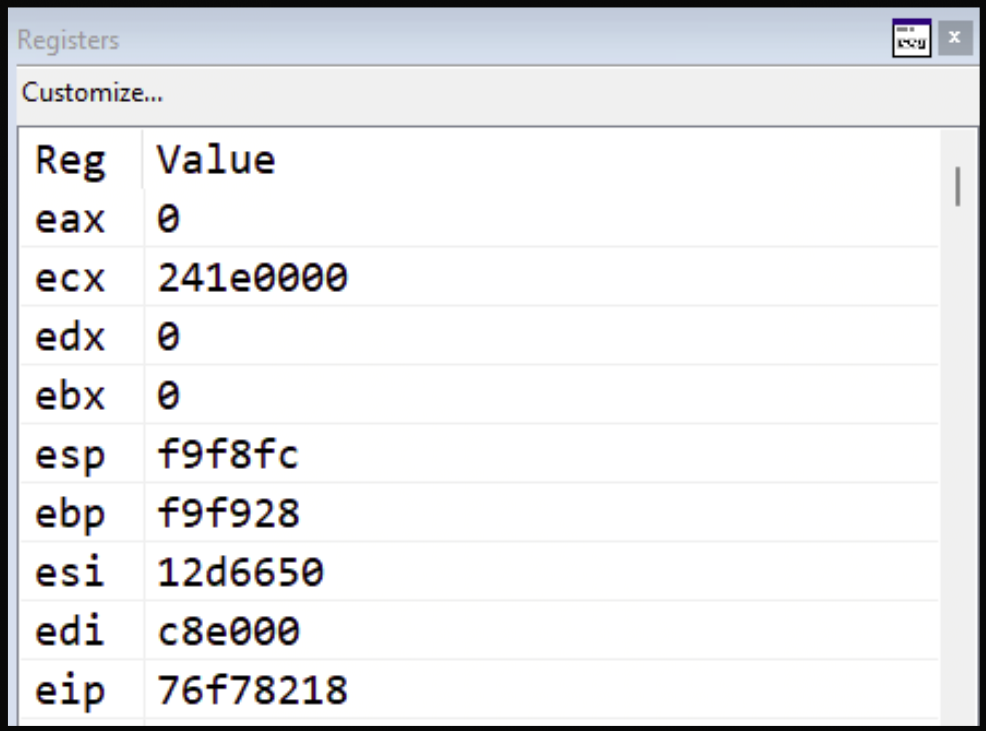
Customizing the WinDBGX GUI
With WinDBGX, Microsoft let go of the idea of using Workspace files.
The GUI now consists of “Layouts” (that can be selected via ‘View’ – ‘Layouts’, or just created by drag/dropping views in place), and some settings that can be found via ‘File’ – ‘Settings’, including Light/Dark Theme and Fonts/Sizes in the ‘General’ section.
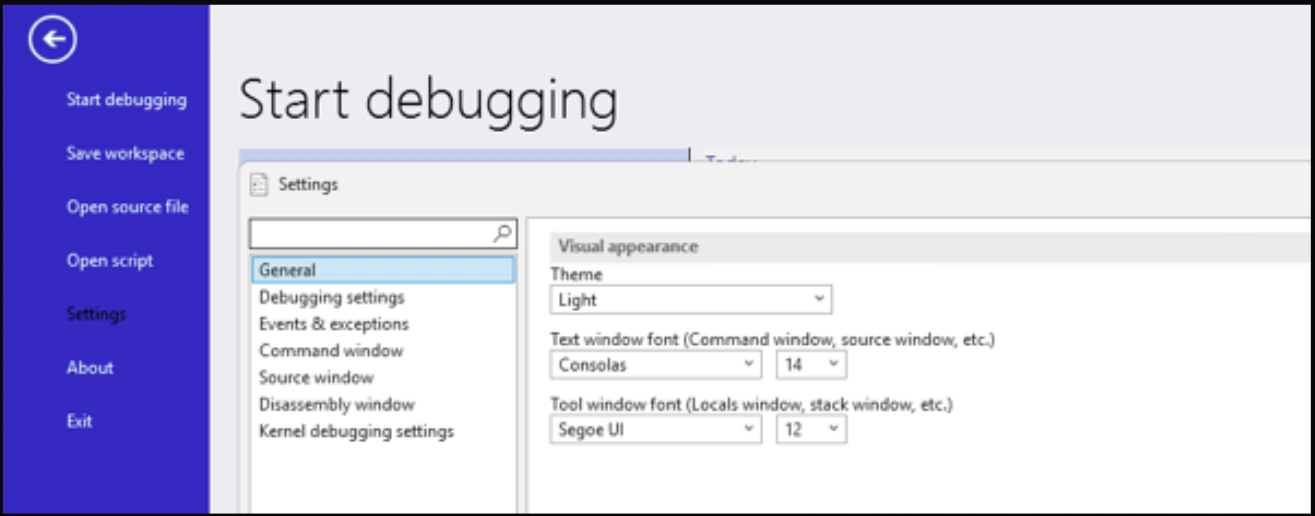
When you open a new view
WinDBGX remembers the changes you have made, and will automatically load the GUI you have created.
Debugging basics
WinDBG Command Line Interface
In this chapter, we’re going to cover the basic operations in a debugger. We’ll learn how to slow down the execution to the individual instruction level. We’ll learn how to use breakpoints to create control. We’ll look at memory contents and perform searches, and we’ll cover how to run mona.py from within WinDBG(X).
Although WinDBG (and especially WinDBGX) has some buttons you can click, the real power of driving WinDBG is its command line interface.
WinDBG(X) has 3 main types of commands:
- Regular commands: allowing us to interact with the process that is being debugged
- Meta commands: allowing us to interact with the debugger (gui). These commands start with a dot .
- Extensions: Invoking plugins (extensions) is done using the exclamation point !
Most of the commands we’ll need are regular commands, but we’ll introduce a few meta commands and extension as well.
Unless specified otherwise, all commands that are discussed in this chapter will work on WinDBG Classic and WinDBGX
Let’s get started.
Execution Control
In this chapter, we’ll study 4 frequently used techniques to control the execution of a process in a debugger:
- g → continue (go)
- t → step into
- p → step over
- gu → step out (go up)
Let’s begin by running windbg.exe and opening our corelanapp1.exe application. We’ll use the -hd flag to avoid activating NtGlobalFlags.
From WinDBG Program Folder, run:
windbg.exe -hd -WF "corelan.wew" g:\blogposts\debugging\corelanapp1\Release\corelanapp1.exeor, if you have created the w.bat file, you can just run
w g:\blogposts\debugging\corelanapp1\Release\corelanapp1.exeAs seen earlier, the process gets created, but hasn’t run any of the application logic yet. WinDBG has control (you can type commands at the Command Line), and the Command Window shows something like this:
(1c54.1e98): Break instruction exception - code 80000003 (first chance)
eax=00000000 ebx=00000000 ecx=479b0000 edx=00000000 esi=01216650 edi=00e23000
eip=76f78218 esp=00ddf9c4 ebp=00ddf9f0 iopl=0         nv up ei pl zr na pe nc
cs=0023  ss=002b  ds=002b  es=002b  fs=0053  gs=002b             efl=00000246
ntdll!LdrpDoDebuggerBreak+0x2b:
76f78218 cc
We could type g to let the process run, but we’ll do something different this time.
When a process gets created, the first code that gets executed from the application binary can be found at the AddressOfEntryPoint field in the PE Header. That field specifies the relative virtual address (RVA) – in other words, the offset from the start – of the place in the application where the first instructions resides. (You can find more information about the PE format here)
We could query that field, but WinDBG has a ‘pseudo-register’ that actually has the address. It’s called $exentry
We’ll talk about breakpoints and pseudo-registers in more detail later on, but let’s go ahead and put a breakpoint already at the AddressOfEntryPoint, by typing the following command at the WinDBG Command Line:
bp @$exentryYou won’t see any output, but we can use the bl command to list the current breakpoints, and we should see that a breakpoint was activated. If you look at the end of the line (and if you have downloaded & stored the corelanapp1.pdb file next to the corelanapp1.exe file earlier on), you should see a reference to corelanapp1!mainCRTStartup. This is the symbol name, found in the corelanapp1.pdb file, that corresponds with the start of the routine that sits at the AddressOfEntryPoint:
0:000> bp @$exentry
0:000> bl
     0 e Disable Clear  00701887     0001 (0001)  0:**** corelanapp1!mainCRTStartup
With a breakpoint active at this location, we can now let the process run. Type g and press return, or just use the F5 key. You should see something like this:
0:000> g
Breakpoint 0 hit
eax=00ddff38 ebx=00e23000 ecx=00701887 edx=00701887 esi=00701887 edi=00701887
eip=00701887 esp=00ddfee4 ebp=00ddfef0 iopl=0         nv up ei pl zr na pe nc
cs=0023  ss=002b  ds=002b  es=002b  fs=0053  gs=002b             efl=00000246
corelanapp1!__scrt_common_main [inlined in corelanapp1!mainCRTStartup]:
00701887 e8cf020000      call    corelanapp1!__security_init_cookie (00701b5b)
The process changes to a running state for a brief moment, and then we see the message Breakpoint 0 hit, followed by a dump of the registers and information about the instruction at EIP. That instruction, the call corelanapp1!__security_init_cookie (00701b5b) in my example above, has not been executed yet.
Good. We’re now at the start of the code referred to by the AddressOfEntryPoint
We’re going to use this context to practice 2 important debugger mechanics:
- Stepping into (t + return, or F11) (The 1 in F11 kind of looks like the i in ‘Into’)
- Stepping over (p + return, or F10) (The 0 in F10 kind of looks like the O in ‘Over’)
Stepping into
Stepping into is a technique that allows us to execute one CPU instruction at a time, allowing us to see its effect.
We can “step into” using the t command + return, or we can simply press the F11 shortkey.
(I’m a big fan of using the shortkeys, as I won’t have to press return every single time)
When you step into (single step), the debugger will show the execution of the next CPU instruction. You’ll see the instruction, a dump of the registers and you can observe the effect of that instruction to the process in real time.
For example, when we would perform a step into in our current debugging session, it would execute the call corelanapp1!__security_init_cookie (00701b5b) instruction. A call instruction will take the CPU to the start of a (child) function. In this case, the child function sits at address 00701b5b. (this address will very likely be different on your system, due to address randomization (ASLR))
When telling the debugger to step into, you’re telling the debugger to have it execute just that instruction and then stop. As expected, the CALL tells the CPU to go to the destination of that CALL (00701b5b) and then stop.
And indeed – that’s exactly where the debugging session is stopped now:
0:000> t
eax=00ddff38 ebx=00e23000 ecx=00701887 edx=00701887 esi=00701887 edi=00701887
eip=00701b5b esp=00ddfee0 ebp=00ddfef0 iopl=0         nv up ei pl zr na pe nc
cs=0023  ss=002b  ds=002b  es=002b  fs=0053  gs=002b             efl=00000246
corelanapp1!__security_init_cookie:
00701b5b 8b0d18407000    mov ecx,dword ptr [corelanapp1!__security_cookie (00704018)] ds:002b:00704018=bce68da3
Going forward, at that location, we see the next instruction:
mov ecx,dword ptr [corelanapp1!__security_cookie (00704018)] ds:002b:00704018=bce68da3Because we have symbols, it provides us with some meaningful information about what it’s going to do. Based on the __security_cookie symbol name, we know that this instruction is going to copy the random master security cookie into ecx, most likely preparing to generate a thread-specific cookie to store it on the stack. Again, values will be different on your system.
The point is, we can observe what is in ecx before executing that mov instruction, and we can see what is in ecx after it has been executed. We can basically see all the changes that are being made to registers, to memory, as it happens.
Before executing the mov, and based on the output above, we see that ecx contains 00701887. If I let the debugger step into (and thus execute that mov instruction), I get to see the effect of it:
0:000> t
eax=00ddff38 ebx=00e23000 ecx=bce68da3 edx=00701887 esi=00701887 edi=00701887
eip=00701b61 esp=00ddfee0 ebp=00ddfef0 iopl=0         nv up ei pl zr na pe nc
cs=0023  ss=002b  ds=002b  es=002b  fs=0053  gs=002b             efl=00000246
corelanapp1!__security_init_cookie+0x6:
00701b61 56              push    esi
ecx now contains bce68da3
You can now continue stepping into, basically executing one instruction at a time, and see what happens every step of the way.
Keep stepping all the way until the next time you see a CALL instruction, but don’t execute it yet.
On my system, the next CALL I got to see is this:
...
0:000> t
eax=00ddff38 ebx=00e23000 ecx=4319725c edx=00701887 esi=00701887 edi=00701887
eip=0070170c esp=00ddfedc ebp=00ddfef0 iopl=0         nv up ei ng nz na pe nc
cs=0023  ss=002b  ds=002b  es=002b  fs=0053  gs=002b             efl=00000286
corelanapp1!__scrt_common_main_seh+0x7:
0070170c e81f070000      call    corelanapp1!__SEH_prolog4 (00701e30)
Ok good. Hold on for a moment, it’s time to talk about “stepping over”.
Stepping over
Stepping into is very powerful because it allows you to see every single step. It’s also very annoying, because you’re seeing every single step.
Let’s say you have already analysed a part of the application, more specifically some function that is being used from time to time. You’ve seen it, you documented it, you understand it.
Next time the application wants to use (or CALL) that function, maybe you don’t want to see the details of that function anymore.
That’s where stepping over comes into play.
If you were following along, the debugger is about to execute a CALL. What if I just want that CALL to happen (and with that, anything that happens inside the corresponding child function), and when it’s done, make it stop.
That’s exactly what stepping over does. It’s super helpful in relation with CALL instructions.
Let’s apply that to our exercise.
We’re here:
corelanapp1!__scrt_common_main_seh:
00701705 6a14            push    14h
00701707 6838367000      push    offset corelanapp1!__rtc_tzz+0x60 (00703638)
0070170c e81f070000      call    corelanapp1!__SEH_prolog4 (00701e30) // ** EIP is here now
00701711 6a01            push    1 // ** When the CALL is done, we expect it to resume execution here
00701713 e8ef010000      call    corelanapp1!__scrt_initialize_crt (00701907)
00701718 59              pop     ecx
00701719 84c0            test    al,al
Type p and hit return or just press the F10 shortkey.
The debugger will now execute the CALL and anything that happens, until the child function returns back to its caller, and resumes execution right after the call.
In your example, that’s the push 1 instruction just beneath it.
So, this is where we are right now:
0:000> t
eax=00ddff38 ebx=00e23000 ecx=4319725c edx=00701887 esi=00701887 edi=00701887
eip=0070170c esp=00ddfedc ebp=00ddfef0 iopl=0         nv up ei ng nz na pe nc
cs=0023  ss=002b  ds=002b  es=002b  fs=0053  gs=002b             efl=00000286
corelanapp1!__scrt_common_main_seh+0x7:
0070170c e81f070000      call    corelanapp1!__SEH_prolog4 (00701e30)
and if we now perform the step over, we get this:
0:000> p
eax=00ddfed0 ebx=00e23000 ecx=4319725c edx=00701887 esi=00701887 edi=00701887
eip=00701711 esp=00ddfeac ebp=00ddfee0 iopl=0         nv up ei ng nz na po nc
cs=0023  ss=002b  ds=002b  es=002b  fs=0053  gs=002b             efl=00000282
corelanapp1!__scrt_common_main_seh+0xc:
00701711 6a01            push    1
Great!
Stepping Source vs Assembly
When the debugger is able to find the source code of the application you’re debugging, then it will very likely activate stepping “source” instead of “assembly”. In other words, when you perform a step, it becomes a “single line of source code”, which means it’s very likely going to step more than one assembly instruction.
If that is the case, don’t forget to turn of “Source mode”
WinDBG: ‘Debug’ – Uncheck ‘Source mode’
WinDBGX: ‘Home’ – ‘Preferences’ – Select ‘Assembly’ instead of ‘Source’
Stepping out (go up)
The last command I’d like to review in this chapter, is “stepping out”. It’s a mechanism that allows you to continue running the current function, but making the execution stop when it’s done. It’s particularly useful if you have accidentally stepped into a function, or if you just want to get out of the current function and resume stepping in the parent function.
The command gu allows you to do so. It executes the rest of the function, until (and including) the RETN at the end of the function. It will go back to the parent and stop right there.
Unassemble: u, ub and uf
In the previous chapter, I provided the disassembly listing at the start of the corelanapp1!__scrt_common_main_seh function:
corelanapp1!__scrt_common_main_seh:
00701705 6a14            push    14h
00701707 6838367000      push    offset corelanapp1!__rtc_tzz+0x60 (00703638)
0070170c e81f070000      call    corelanapp1!__SEH_prolog4 (00701e30)
00701711 6a01            push    1
00701713 e8ef010000      call    corelanapp1!__scrt_initialize_crt (00701907)
00701718 59              pop     ecx
00701719 84c0            test    al,al
How can we produce a disassembly listing like this in WinDBG?
First of all, there is a dedicated Disassembly view.
If you are using the dark.wew or corelan.wew workspaces, you should already have it on your screen. If not, you can open it by clicking ‘View’ and then chosing ‘Disassembly’.
By default, the Offset: field at the top of the view is set to @scopeip, which means it will show the instructions around EIP. (In fact, I copied the disassembly listing from that view.)
That said, we can use the u command (unassemble forward) in WinDBG to produce a disassemble listing from any location.
We just need to provide the memory location after the u and we’ll get to see the instructions from that point forward.
For example:
0:000> u eip
corelanapp1!__scrt_common_main_seh+0xc [d:\agent\_work\3\s\src\vctools\crt\vcstartup\src\startup\exe_common.inl @ 237]:
00701711 6a01            push    1
00701713 e8ef010000      call    corelanapp1!__scrt_initialize_crt (00701907)
00701718 59              pop     ecx
00701719 84c0            test    al,al
0070171b 0f8450010000    je      corelanapp1!__scrt_common_main_seh+0x16c (00701871)
00701721 32db            xor     bl,bl
00701723 885de7          mov     byte ptr [ebp-19h],bl
00701726 8365fc00        and     dword ptr [ebp-4],0
Of course, you can also show the instructions before a certain point, using ub location (unassemble backward).
For instance ub eip:
0:000> ub eip
corelanapp1!pre_cpp_initialization+0x5 [d:\agent\_work\3\s\src\vctools\crt\vcstartup\src\startup\exe_common.inl @ 222]:
007016f8 e8a9040000      call    corelanapp1!_matherr (00701ba6)
007016fd 50              push    eax
007016fe e8f20a0000      call    corelanapp1!set_new_mode (007021f5)
00701703 59              pop     ecx
00701704 c3              ret
corelanapp1!__scrt_common_main_seh [d:\agent\_work\3\s\src\vctools\crt\vcstartup\src\startup\exe_common.inl @ 236]:
00701705 6a14            push    14h
00701707 6838367000      push    offset corelanapp1!__rtc_tzz+0x60 (00703638)
0070170c e81f070000      call    corelanapp1!__SEH_prolog4 (00701e30)
Just like the u command earlier on, what you’ll get is just a linear translation of the bytes at that location in memory. It does not actually follow the code flow. What you see is not necessarily the sequence of execution.
In both cases, you see that the u and ub commands produce a given number of lines of output.
With pretty much any command that shows contents (display memory, disassembly of instructions), you can direct WinDBG how many entities of output you’d like to see.
To do so, you can use L number. The ‘number’ indicate how many entities you’d like to see.
When asking for a disassembly listing, the “entity” is an instruction. In this case, the L specifier will affect how many lines you get to see.
For example:
0:000> u eip L 4
corelanapp1!__scrt_common_main_seh+0xc [d:\agent\_work\3\s\src\vctools\crt\vcstartup\src\startup\exe_common.inl @ 237]:
00701711 6a01            push    1
00701713 e8ef010000      call    corelanapp1!__scrt_initialize_crt (00701907)
00701718 59              pop     ecx
00701719 84c0            test    al,al
4 lines of instructions, as expected.
In addition to u and ub, there is another interesting command from the u-range: uf (unassemble function).
This command will disassemble an entire function (or as close as possible) instead of a certain range of instructions. uf will use symbols & heuristics to determine the boundaries of the function and will then spit out the full disassembly listing for that function. As a result of the nature of the command, it should be clear that ufis mostly useful when you run it against the start of a function. You can use the function address or the symbol name associated with a function.
For example:
u ntdll!RtlAllocateHeap: prints out just a few lines at the start of the function
uf ntdll!RtlAllocateHeap: prints out the entire function
0:000> u ntdll!RtlAllocateHeap
ntdll!RtlAllocateHeap:
76e9f8a0 8bff            mov     edi,edi
76e9f8a2 55              push    ebp
76e9f8a3 8bec            mov     ebp,esp
76e9f8a5 6afe            push    0FFFFFFFEh
76e9f8a7 68b8dbf776      push    offset ntdll!SbGetContextDetailsById+0x70b (76f7dbb8)
76e9f8ac 68b01dee76      push    offset ntdll!_except_handler4 (76ee1db0)
76e9f8b1 64a100000000    mov     eax,dword ptr fs:[00000000h]
76e9f8b7 50              push    eax
0:000> uf ntdll!RtlAllocateHeap
Flow analysis was incomplete, some code may be missing
ntdll!RtlAllocateHeap:
76e9f8a0 8bff mov edi,edi
76e9f8a2 55 push ebp
76e9f8a3 8bec mov ebp,esp
76e9f8a5 6afe push 0FFFFFFFEh
76e9f8a7 68b8dbf776 push offset ntdll!SbGetContextDetailsById+0x70b (76f7dbb8)
76e9f8ac 68b01dee76 push offset ntdll!_except_handler4 (76ee1db0)
76e9f8b1 64a100000000 mov eax,dword ptr fs:[00000000h]
76e9f8b7 50 push eax
76e9f8b8 83ec08 sub esp,8
76e9f8bb 53 push ebx
76e9f8bc 56 push esi
76e9f8bd 57 push edi
76e9f8be a1e0c3f976 mov eax,dword ptr [ntdll!__security_cookie (76f9c3e0)]
76e9f8c3 3145f8 xor dword ptr [ebp-8],eax
76e9f8c6 33c5 xor eax,ebp
76e9f8c8 50 push eax
76e9f8c9 8d45f0 lea eax,[ebp-10h]
76e9f8cc 64a300000000 mov dword ptr fs:[00000000h],eax
76e9f8d2 8965e8 mov dword ptr [ebp-18h],esp
76e9f8d5 8b7508 mov esi,dword ptr [ebp+8]
76e9f8d8 85f6 test esi,esi
76e9f8da 750e jne ntdll!RtlAllocateHeap+0x4a (76e9f8ea) Branch
...
76ea01a1 8be5 mov esp,ebp
76ea01a3 5d pop ebp
76ea01a4 c21000 ret 10hBreakpoints (bp, ba)
Debuggers provide the ability to create breakpoints, and breakpoints are what will give you control.
There are 2 types of breakpoints:
- Software breakpoints
- Hardware breakpoints
The difference lies in how the CPU is made to interrupt the execution.
Software breakpoints:
When you set a software breakpoint at a certain address, you’re telling the debugger you want to make the CPU stop when it tries to execute the instruction at that location.
When creating a breakpoint at that address, the debugger replace the first byte in memory at that location with the CC byte, wwhich corresponds with the INT3instruction.
When the CPU reaches that address and executes it, it will raise a STATUS_BREAKPOINT exception, which gets picked up by the debugger, and that makes the execution stop.
As the debugger remembers what the original byte was (before it replaced it with CC, it’s able to show you the original byte, and with that, the original instruction.
You can pretty much create as many software breakpoints as you want, but please keep in mind that it involves changing memory.
Hardware Breakpoints
Hardware breakpoints use CPU debug registers (DR0 to DR3). Additionally, register DR7 is used for flags (type and size). As the hardware breakpoints use registers, they are thread specific, not process wide.
You can set 4 hardware breakpoints at a time, and for each of them, you have to indicate not just the address, but also the type of access you’d like the CPU to break on (Read, Write or Execute) and the size (number of bytes to monitor)
The CPU will monitor access/execution and will trigger a STATUS_SINGLE_STEP exception when a condition is met.
In short: hardware breakpoints require an address, access type, and size because the CPU debug registers must know what to monitor, how to monitor it, and how many bytes are involved.
Software breakpoints
Breakpoints are managed via a series of commands that begin with b:
- bp : create a breakpoint
- bl : show all breakpoints
- bc : clear a breakpoint
- be : enable a breakpoint
- bd : disable a breakpoint
In its most basic form, creating a breakpoint is a simple as typing the bp command, followed by the location where you’d like to put the breakpoint.
We can see the list of breakpoints using the bl command.
Open a new debugging session using the corelanapp1.exe binary, but don’t let the application run yet. In other words, open the executable in the debugger and don’t anything yet at the initial break. You should see something like this:
(1d30.1ed8): Break instruction exception - code 80000003 (first chance)
eax=00000000 ebx=00000000 ecx=f7780000 edx=00000000 esi=00e36628 edi=0080d000
eip=76f78218 esp=00b6f38c ebp=00b6f3b8 iopl=0         nv up ei pl zr na pe nc
cs=0023  ss=002b  ds=002b  es=002b  fs=0053  gs=002b             efl=00000246
ntdll!LdrpDoDebuggerBreak+0x2b:
76f78218 cc              int     3
Let’s create a breakpoint at the RtlAllocateHeap function in ntdll:
bp ntdll!RtlAllocateHeap
If all goes well, you won’t see output.
We can now use the bl command to see all breakpoints:
0:000> bl
     0 e Disable Clear  76e9f8a0     0001 (0001)  0:**** ntdll!RtlAllocateHeap
Let’s examine what we see:
- 0: this is the internal breakpoint ID, it’s a unique number assigned by WinDBG. Technically, we can define a number yourself, I’ll explain in a moment how to do so
- e: this indicates that the breakpoint is enabled. We have the ability to enable and disable breakpoints
- Disable : this clickable link allows you to Disable an enabled breakpoint. If the breakpoint was disabled, you’d see Enable instead. If you hover the mouse over the clickable link, you’ll see the be 0 command in WinDBG’s status tray, just below the Command Line input box.
- Clear : this clickable link allows you to clear (remove) the breakpoint. Hold the mouse pointer over the link, and you’ll see the bc 0 command in the status tray.
- 76e9f8a0 : although we used a symbol name as destination, WinDBG has resolved it into the corresponding absolute address.
- 0001 : this indicates the current remaining count, related with the pass count (see next bullet point). If you would configure a pass count higher than 1, you can see this counter decrementing until it gets to 1
- (0001) : this is the pass count. A count of 1 means the breakpoint will hit the first time the CPU goes to that location. I’ll take about pass count in a moment.
- 0:**** : this is the thread/process applicability field. First part (before the colon) is the process (0 = internal sequence number in WinDBG). **** means all threads.
- ntdll!RtlAllocateHeap : WinDBG prints the symbol name that corresponds with the address
Enable (be), Disable (bd), Clear (bc)
Once we have the ID, we can interact with a breakpoint. We can disable it, enable it, clear it.
be 0 enables breakpoint with id 0
bd 0 disables breakpoint with id 0
bc 0 clears breakpoint with id 0
We can also clear all breakpoints using bc *
Specifying a custom ID to a breakpoint
As indicated earlier, we have the ability to specify an ID right away. In order to do so, we have to glue the desired ID number to the bp command, followed by the desired location.
For instance, let’s say I want to create breakpoint with ID 666 on ntdll!RtlFreeHeap:
0:000> bp666 ntdll!RtlFreeHeap
0:000> bl
     0 e Disable Clear  76e9f8a0     0001 (0001)  0:**** ntdll!RtlAllocateHeap
    666 e Disable Clear  76e9ee30     0001 (0001)  0:**** ntdll!RtlFreeHeap
Take note: the ID/number needs to be glued to bp. No spaces!!
Now I don’t have to look up the ID for this breakpoint. I know my breakpoint has ID 666, allowing me to very easily enable, disable or clear it.
With the 2 breakpoints active, let the process run (type g) and see what happens.
0:000> g
Breakpoint 0 hit
eax=007f0008 ebx=00000000 ecx=00e30000 edx=000000c4 esi=00000010 edi=00000000
eip=76e9f8a0 esp=00b6f138 ebp=00b6f14c iopl=0         nv up ei pl nz na pe nc
cs=0023  ss=002b  ds=002b  es=002b  fs=0053  gs=002b             efl=00000206
ntdll!RtlAllocateHeap:
76e9f8a0 8bff            mov     edi,edi
Apparently the CPU ended up going to the RtlAllocateHeap function, hitting breakpoint 0, and making the process stop. As expected.
Pass count
When we examined the output of bl, I indicated that we have the ability to specify a “pass count”. A pass count allows me to specify how many times a certain breakpoint needs to be hit before I want the debugger to actually stop.
Let’s say I want to ignore the first 29 iterations of RtlAllocateHeap, and only stop the 30th time, I can specify the pass count after the address in the bp statement:
bp ntdll!RtlAllocateHeap 30
0:000> bp ntdll!RtlAllocateHeap 30
breakpoint 0 redefined
0:000> bl
     0 e Disable Clear  76e9f8a0     0030 (0030)  0:**** ntdll!RtlAllocateHeap
    666 e Disable Clear  76e9ee30     0001 (0001)  0:**** ntdll!RtlFreeHeap
Here we see the pass count is set to (0030), and the remaining counter is set to 0030 as well. Every time the ntdll!RtlAllocateHeap function gets used, it will decrement the remaining counter. When that counter becomes 1, the process will stop.
Let the process continue running:
0:000> g
Breakpoint 666 hit
eax=0080d000 ebx=00e3d4a8 ecx=00000000 edx=00e3d49c esi=00e3c400 edi=00e3d4a8
eip=76e9ee30 esp=00b6f17c ebp=00b6f18c iopl=0         nv up ei pl zr na pe nc
cs=0023  ss=002b  ds=002b  es=002b  fs=0053  gs=002b             efl=00000246
ntdll!RtlFreeHeap:
76e9ee30 8bff            mov     edi,edi
0:000> bl
     0 e Disable Clear  76e9f8a0     0029 (0030)  0:**** ntdll!RtlAllocateHeap
    666 e Disable Clear  76e9ee30     0001 (0001)  0:**** ntdll!RtlFreeHeap
The breakpoint on RtlFreeHeap got triggered, and that gives us the opportunity to examine the pass count/remaining counter setting for RtlAllocateHeap. In the example above, we see that RtlAllocateHeap was actually used once already, the remaining counter is now set to 0029. We’ll just have to wait until it decrements to 1 before the breakpoint on RtlAllocateHeap will hit again.
So, let the process continue running again:
0:000> g
Breakpoint 0 hit
eax=00000001 ebx=00000023 ecx=00000022 edx=0000000e esi=00000023 edi=00e3dbc1
eip=76e9f8a0 esp=00b6f16c ebp=00b6f184 iopl=0         nv up ei pl nz na po nc
cs=0023  ss=002b  ds=002b  es=002b  fs=0053  gs=002b             efl=00000202
ntdll!RtlAllocateHeap:
76e9f8a0 8bff            mov     edi,edi
0:000> bl
     0 e Disable Clear  76e9f8a0     0001 (0030)  0:**** ntdll!RtlAllocateHeap
    666 e Disable Clear  76e9ee30     0001 (0001)  0:**** ntdll!RtlFreeHeap
This time, breakpoint 0 got hit, and we can see that the Remaining Counter has become 1. In fact, it will remain 1. From this point forward, the breakpoint will hit every single time.
Let’s wrap up the exercise. Clear all breakpoints with bc * and confirm they’re gone.
Setting mass-breakpoints using symbol wildcards
The bm command allows us to set breakpoints on multiple addresses in one shot, and you can use wildcards to find the locations you’d like to break on. Let’s say you want to put a breakpoint on al functions that contain the word “heap” in kernel32.
First of all, we can do a symbol search using the x command:
The syntax is quite simple: modulename (or wildcard) ! symboldname (or wildcard)
So if you’d like to find all symbol names that contain the word heap inside kernel32, then the search would be
kernel32!*heap*
Let’s try:
0:000> x kernel32!*heap*
757e4082          KERNEL32!WerpGetHeapHandle (void)
757e49b0          KERNEL32!WerpHeapUnLock (void)
757e48f1          KERNEL32!WerpHeapGetBlockFromFreeList (void)
757e4986          KERNEL32!WerpHeapLock (void)
757e44cb          KERNEL32!WerpHeapAddBlockToTail (void)
757f13f0          KERNEL32!HeapDestroyStub (no parameter info)
757d41b0          KERNEL32!HeapFreeStub (no parameter info)
75841430          KERNEL32! api-ms-win-core-heap-obsolete-l1-1-0_NULL_THUNK_DATA =
757f1470          KERNEL32!HeapUnlockStub (no parameter info)
758413fc          KERNEL32!_imp__HeapValidate =
758413e8          KERNEL32!_imp__HeapFree =
758413d4          KERNEL32!_imp__HeapQueryInformation =
The x command only performs a search and we get to see the output.
It doesn’t set a breakpoint yet. That’s what the bm command can do.
Simply replace x with bm and see what happens:
0:000> bm kernel32!*heap*
  1: 757e4082          @!"KERNEL32!WerpGetHeapHandle"
  2: 757e49b0          @!"KERNEL32!WerpHeapUnLock"
  3: 757e48f1          @!"KERNEL32!WerpHeapGetBlockFromFreeList"
  4: 757e4986          @!"KERNEL32!WerpHeapLock"
  5: 757e44cb          @!"KERNEL32!WerpHeapAddBlockToTail"
  6: 757f13f0          @!"KERNEL32!HeapDestroyStub"
  7: 757d41b0          @!"KERNEL32!HeapFreeStub"
  8: 757f1470          @!"KERNEL32!HeapUnlockStub"
  9: 757f1430          @!"KERNEL32!HeapQueryInformationStub"
 10: 757e4748          @!"KERNEL32!WerpHeapCreate"
 11: 75820930          @!"KERNEL32!Heap32ListFirst"
 12: 757e4500          @!"KERNEL32!WerpHeapAlloc"
 13: 757f1490          @!"KERNEL32!HeapValidateStub"
 14: 757ddf54          @!"KERNEL32!RtlFreeHeap"
 15: 75820a80          @!"KERNEL32!Heap32Next"
 16: 757ddf48          @!"KERNEL32!RtlAllocateHeap"
 17: 757dd210          @!"KERNEL32!HeapCreateStub"
 18: 757f14b0          @!"KERNEL32!HeapWalkStub"
 19: 757f0f30          @!"KERNEL32!GetProcessHeapsStub"
 20: 757e49d4          @!"KERNEL32!WerpValidateHeapSignature"
 21: 757de1cc          @!"KERNEL32!RtlSizeHeap"
 22: 757f13d0          @!"KERNEL32!HeapCompactStub"
 23: 757dd5b0          @!"KERNEL32!HeapSetInformationStub"
 24: 757e3390          @!"KERNEL32!GetProcessHeap"
 25: 758209e0          @!"KERNEL32!Heap32ListNext"
 26: 757f1450          @!"KERNEL32!HeapSummaryStub"
 27: 757e47bb          @!"KERNEL32!WerpHeapFree"
 28: 757f1410          @!"KERNEL32!HeapLockStub"
 29: 758206c0          @!"KERNEL32!Heap32First"
Hardware breakpoints
You can set a hardware breakpoint with the ba command. The basic syntax is:
ba type+size addressThere are 4 types:
- r read
- w write
- rw read or write
- e execute
The sizes are CPU/architecture dependent, but they typically are 1, 2, 4 and 8 (for 64bit)
So, for example, let’s say you want the CPU to break when any code makes a change to any of the 4 bytes beginning at address 0x12345678, the breakpoint statement would be
ba w4 0x12345678If you’d like to break on execution at 0x00400234, you can do:
ba e1 0x00400234Hardware breakpoints will show up in the output of bl and you can use the be, bd and bc commands to enable, disable and clear them, just like software breakpoints.
From breakpoint to dynamic logging system
In the past 2 chapters, we’ve explored in great detail how we can create and manage software and hardware breakpoints. Up until this point, we’ve been using breakpoints to interrupt the execution of the process. But in reality, WinDBG allows us to execute WinDBG statements whenever a breakpoint gets hit. And that allows us to turn the breakpoint system into a dynamic logger.
Before looking at how to do this, let’s put a few facts on the table.
- We have the ability to put multiple WinDBG commands on one line, simply separate them by a semi-colon.
- We can print information using the .printf statement. This meta-command takes text and variables, between double quotes. We can use C-style format specifiers to format the variables.
The basic format to link one or more WinDBG statements to a breakpoint is this:
bp[id] address [passcount] "windbgstatement1;statement2;gc"Putting a gc as the last instruction, will turn the traditional “break” point into a mechanism that can print context-specific information and then simply continue running.
According to MS documentation, using gc as the final command in the breakpoint action (instead of g) might be slightly faster.
Printing context-specific information to the screen (register, memory contents, etc) requires some sort of print statement. The meta-command to do so, taking variables, is .printf. It takes double quotes and C-style variables/format specifiers. The entire .print statement will sit inside the double quotes that are required in the bp statement. With double quotes inside double quotes, we’ll need to escape the inner double quotes with a backslash.
Let’s look at a simple example: Let’s say you want to print the value in eax as a pointer, and the value in ecx as a hex number to the screen.
The corresponding .printf statement would be
.printf "eax: 0x%p, ecx: 0x%x\n", @eax, @ecxTo embed this inside a WinDBG breakpoint, we have to escape the double quotes with a backslash. We also have to escape the backslash that was used for the newline. The correct bp statement looks like this:
bp address ".printf \"eax: 0x%p, ecx: 0x%x\\n\", @eax, @ecx"This breakpoint will print the information and then stop. If we want to turn it into a dynamic logger, we have to instruct it to continue running after printing the requested information. We can do that by adding ;gat the end, inside the outer double quotes:
bp address ".printf \"eax: 0x%p, ecx: 0x%x\\n\", @eax, @ecx ; gc"Check the “Commands Overview” table at the end of this document for more information about some of the available format specifiers.
ASLR-friendly breakpoints
In an ALSR environment, setting (and documenting) breakpoint on addresses that are impacted by ASLR, may very likely invalidate the breakpoint statement as soon you close the process. The absolute address will likely be different in the next run. In other works, you can’t copy/paste breakpoints that are set on absolute addresses.
It’s a good habit to use breakpoint statements that don’t use hardcoded addresses , but rather use a relative offset from something that can be referenced reliably. For example, the start of the module a certain address belongs to.
From ASLR-enabled absolute address to ASLR-friendly relative address
Run the corelanapp1.exe binary in a debugger and let’s take ntdll’s RtlAllocateHeap function as an example.
It’s pretty easy to locate that function if we have symbols.
0:000> x ntdll!RtlAllocateHeap
773bf8a0          ntdll!RtlAllocateHeap (no parameter info)
And with symbols, we can put a breakpoint at ntdll!RtlAllocateHeap (instead of the address). WinDBG will resolve it, and the breakpoint will land in the right place every time.
Even if you reboot your machine, the symbol name will resolve to the correct position.
0:000> bp ntdll!RtlAllocateHeap
0:000> bl
     0 e Disable Clear  773bf8a0     0001 (0001)  0:**** ntdll!RtlAllocateHeap
But what if you’d like to put a breakpoint somewhere in the middle of some random function.
Or in a function for a module that doesn’t have symbols?
In the example above, RtlAllocateHeap sits at 773bf8a0.
For the sake of the exercise, let’s use that address as an example.
We know the function resides in ntdll.
Instead of using the function symbol name, I can also set a breakpoint at an offset from the start of ntdll.
Unless the version of ntdll changes, the offset from the start of the module, to that position, will always be the same.
Even without symbols, I can always use the name of a module to make a calculation.
First, I have to determine the offset from the start of ntdll to my chosen address. I can use WinDBG’s “MASM” expression evaluator to do this: ?
The syntax is quite simple:
? address – module_it_belongs_to
Example:
0:000> ?773bf8a0-ntdll
Evaluate expression: 260256 = 0003f8a0
On my system, my address sits at offset 0003f8a0 from the start of ntdll.
I can now make a breakpoint at that location exactly, without having to hardcode its address, nor rely on symbols:
0:000> bc *
0:000> bp ntdll+0003f8a0
0:000> bl
     0 e Disable Clear  773bf8a0     0001 (0001)  0:**** ntdll!RtlAllocateHeap
In short, you can set a breakpoint at a Symbol name (the name of a function, and thus the start of a function), and at an offset from the start of a module.
In my experience, it may not be a good idea to set breakpoints at an offset from a symbol name.
So, this is reliable:
bp ntdll!RtlFreeHeap
bp ntdll+0x1234
but this breakpoint may not end up where you want or expect it to be.
bp ntdll!RtlAllocateHeap+0x168MASM Expression evaluator (?)
I’ll go a little deeper into WinDBG’s expression evaluators in a future post.
For now, please remember that you can invoke the MASM expression evaluator using the question mark, and you can use it to perform arithmetic operations.
You can use numbers, symbols names, pseudo-registers, real registers, the name of a module (which works even without symbols). You can dereference an address using the poi() function.
When using registers, it’s recommended to prefix the register name with @. That way, you’re telling the expression evaluator that you want the value of the register.
MASM is the default expression evaluator used in:
- ? expression statements,
- breakpoint conditions (see next chapter),
- .if / .for / .foreach routines (I’ll talk more about that in a future post),
- display/dump commands (d-commands)
- unassemble commands (u-commands)
- etc
Conditional breakpoints
The last thing I’d like to share about breakpoints today, is that we have the ability to define conditional breakpoints.
In other words, we can have a breakpoint do something if a certain condition is met, and do something else otherwise. If you’re using breakpoints for dynamic logging, don’t forget to let the breakpoint continue running in both the then and else branch. According to document, you’re supposed to use gc (continue from condition) instead of g
the basic syntax is this:
bp address "j (Condition) 'OptionalCommands; gc'; 'gc';"
bp address ".if (Condition) {OptionalCommands; gc} .else {gc}"
.printf Debugger Markup Language (DML)
I’d like to add another cool trick to our toolbox. With .printf, we have the ability to use DML, or Debugger Markup Language.
This allows you to create clickable links, colorize output, make output bold.
You have to specify the /D flag, which enables the feature. Without /D, the rest is considered raw text.
A quick overview:
Clickable command
<link cmd=”…”>…</link> : Runs a debugger command (Disable breakpoint: bd 42)
Clickable script execution
<link cmd=”$<file”>…</link> : Runs a script file (Load command file: $<c:\temp\script.txt)
Highlight text (color)
<col fg=”…” bg=”…”>…</col> : Adds foreground/background color (Highlight warning text)
Bold / emphasis
<b>…</b> : Makes text bold (Emphasize breakpoint hit)
Disassembly shortcut
<link cmd=”u addr”>…</link> : Disassembles code at address (Jump to @rip)
Memory view
<link cmd=”db addr”>…</link> : Dumps memory at address (Inspect buffer at @rip)
Register view
<link cmd=”r”>…</link> : Displays registers (Quick state check with r)
Stack trace
<link cmd=”k”>…</link> : Shows call stack (Execution context via k)
Conditional execution
<link cmd=”j (cond) ‘cmd1’; ‘cmd2′”>…</link> : Executes logic based on condition (Check register value using j (@rax==0) ‘.echo zero’; ‘.echo nonzero’)
Multiple commands
<link cmd=”cmd1;cmd2″>…</link> : Runs multiple commands sequentially (Disassemble and stack trace using u @rip;k)
You can’t use dynamic formatting inside attributes though. <link cmd=”bd %d”> won’t work, the string must be fully resolved.
Some examples of clickable links and formatting:
Disable a breakpoint
bp666 ntdll+0x1234 ".printf /D \"<b>bp666 hit at %y</b> <link cmd=\\\"bd 666\\\">[disable]</link>\\n\", $ip; gc"Disassemble current location
.printf /D "Execute at <link cmd='u @rip'>%p</link>\n", @ripDump memory at current instruction
.printf /D "Memory <link cmd='db @rip'>[dump @rip]</link>\n"Show registers on demand
.printf /D "<link cmd='r'>[show registers]</link>\n"Show stack trace
.printf /D "<link cmd='k'>[show stack]</link>\n"Quick triage (disasm + call stack)
.printf /D "<link cmd='u @rip; kb'>[analyze here]</link>\n"Jump to function
.printf /D "<link cmd='uf kernel32!CreateFileW'>[CreateFileW]</link>\n"Conditional check (quick sanity)
.printf /D "<link cmd="j (@rax==0) '.echo zero'; '.echo nonzero'">[check rax]</link>\n"Run helper script
.printf /D "<link cmd='$<c:\temp\triage.txt'>[run triage]</link>\n"List / clear breakpoints
.printf /D "<link cmd='bl'>[list bp]</link> <link cmd='bc *'>[clear all]</link>\n"Color-highlighted hit
.printf /D "<col fg='black' bg='yellow'>HOT PATH</col> at %p\n", @ripLooking at memory (d)
The d-series of commands allow us to inspect the contents of memory. We obviously need to provide the address we’d like to inspect/display/dump, and we can also control the output formatting.
There are a few ways of looking at memory:
- Raw: We can “dump” the raw contents and simply format the output
- Typed: We can take the contents and apply a datastructure/prototype over it, asigning bytes to field contents
- As a variation to the previous item, we can use it to construct linked list by reading values and considering them elements in a list
Raw dump + formatting
Dumping or displaying memory and formatting the output can be done by simply providing an output formatting indicator to the d command.
Popular d commands that use specific format types are:
- db : bytes
- dw : words
- dd : double words
- dq : quad words
- dp : pointers (architecture-aware)
- dps : pointers + symbol names
- da : ansi string (null terminated)
- du : unicode string (double null terminated)
- dc : double words + ansi values
- dyb : bits
Let’s look at a few basic examples. Open the corelanapp1.exe binary, let it run, and attach WinDBG to it.
We’re going to look at the stack in a few different ways. The esp register points at the top of the stack consumption. We’ll use WinDBG to look at the contents at esp.
Type the following command and see what happens:
0:003> db esp
00e2fc98  39 de 44 77 08 5f 90 94-00 de 44 77 00 de 44 77  9.Dw._....Dw..Dw
00e2fca8  00 00 00 00 9c fc e2 00-00 00 00 00 1c fd e2 00  ................
00e2fcb8  b0 1d 40 77 34 44 3b e3-00 00 00 00 d4 fc e2 00  ..@w4D;.........
00e2fcc8  49 5d 00 75 00 00 00 00-30 5d 00 75 2c fd e2 00  I].u....0].u,...
00e2fcd8  1b d8 3e 77 00 00 00 00-e0 5e 90 94 00 00 00 00  ..>w.....^......
00e2fce8  00 00 00 00 00 00 00 00-00 00 00 00 00 00 00 00  ................
00e2fcf8  00 00 00 00 00 00 00 00-00 00 00 00 00 00 00 00  ................
00e2fd08  00 00 00 00 00 00 00 00-00 00 00 00 e0 fc e2 00  ................
of course, the actual addresses and contents will be different on your system. We’re merely looking at how the contents are presented, not what they mean
db prints the contents, one byte at a time. It’s worth noting that, with every d command, we can tell WinDBG how many lines of entities we want to see, by adding L number to the statement.
In the case of db, the entity is a byte.
0:003> db esp L 4
00e2fc98  39 de 44 77                                      9.Dw
Suppose we want to output the values on the stack as pointers. We can use the dp or the dps command to do so. In this case, the entities are pointers, so the L argument will affect how many pointers we’ll see:
0:003> dp esp L 6
00e2fc98  7744de39 94905f08 7744de00 7744de00
00e2fca8  00000000 00e2fc9c

0:003> dps esp L 6
00e2fc98  7744de39 ntdll!DbgUiRemoteBreakin+0x39
00e2fc9c  94905f08
00e2fca0  7744de00 ntdll!DbgUiRemoteBreakin
00e2fca4  7744de00 ntdll!DbgUiRemoteBreakin
00e2fca8  00000000
00e2fcac  00e2fc9c
I’ll let you experiment with the other output types and the effect of the L argument.
Typed display/dump
The dt command allows us to display the contents at a certain address, but organize the output based on a certain datastructure.
The theory is quite simple:
- We’re going to dump memory at a certain location. Of course, you have to be sure that you’re really providing the exact location of the datastructure. After all, dtis dumb, it won’t complain if you’re telling to display memory at some random location. It will happily overlay the bytes at any location with the datastructure fields.
- We also need to provide the corresponding datastructure/type name. That implies you know what the actual type name is.
To be more specific, the syntax is dt type location
How do I know what types even exist?
Well, datastructures/types can be found in symbols.
Microsoft provides symbols for its Operating Systems, so we can find/use lower level OS datastructures that are documented in the symbols for ntdll, amongst others.
Of coure, we can perform a symbol search using the x command.
The problem is that we may not have filters available that only show types. x will basically search all symbols, regardless of what they are.
You can produce a list of ALL symbols (functions, global variables as well as types (structs, unions, etc) in ntdll using the following command:
x ntdll!*You’ll notice that this list is way too long to be useable. But ok, it would be a starting point.
Maybe you already know what kind of information you’re trying to investigate and are just looking for the correct spelling.
It may be related with HEAP. Or TEB, or PEB. In any case, you may be able to come up with some keywords, and use those to perform a more specific search using dt:
A few examples of useful searches include:
dt -v ntdll!_HEAP*
dt -v ntdll!_TEB*
dt -v ntdll!_PEB*
Still, it would be nice to have the full list of types without having to make any assumptions in terms of keywords.
We may be able to to create something that gets close to that relatively easy.
In fact, the output of dt -v shows an address when it finds a function, and leaves the address field empty for datatypes.
For example:
0:003> dt -v ntdll!*HEAP
Enumerating symbols matching ntdll!*HEAP
Address   Size Symbol
           258 ntdll!_HEAP
           6c0 ntdll!_SEGMENT_HEAP
           7e8 ntdll!_LFH_HEAP
774286c1   0c4 ntdll!pqdownheap
7747ab4c   0d8 ntdll!RtlpHeapTrkTrackRemoveHeap
773d431f   240 ntdll!RtlpExtendHeap
773b5949   000 ntdll!LdrProtectMrdataHeap (no type info)
The first 3 lines of output show types, followed by some functions.
In other words, if you were to print out all symbol names with dt -v, but only keep the ones that begin with (11 spaces), maybe you’ll get close to the actual list of types.
We can take the output of a WinDBG command and pipe it into a shell command such as findstr:
0:003> .shell -ci "dt -v ntdll!*" findstr -C:"       "
           010 ntdll!LIST_ENTRY64
           008 ntdll!LIST_ENTRY32
           004 ntdll!_ARM64_FPCR_REG
           004 ntdll!_ARM64_FPSR_REG
           004 ntdll!_AMD64_MXCSR_REG
           004 ntdll!SE_WS_APPX_SIGNATURE_ORIGIN
           004 ntdll!_PS_MITIGATION_OPTION
           018 ntdll!_PS_MITIGATION_OPTIONS_MAP
           018 ntdll!_PS_MITIGATION_AUDIT_OPTIONS_MAP
           00c ntdll!_KSYSTEM_TIME
           004 ntdll!_NT_PRODUCT_TYPE
           004 ntdll!_ALTERNATIVE_ARCHITECTURE_TYPE
...
.shell: Process exited
Assuming that you have found the type you need, you can now run dt TYPE location.
For instance, if you would like to see the contents of the PEB, you can run this:
0:003> dt _PEB @$peb
ntdll!_PEB
   +0x000 InheritedAddressSpace : 0 ''
   +0x001 ReadImageFileExecOptions : 0 ''
   +0x002 BeingDebugged    : 0x1 ''
   +0x003 BitField         : 0x4 ''
   +0x003 ImageUsesLargePages : 0y0
   +0x003 IsProtectedProcess : 0y0
   +0x003 IsImageDynamicallyRelocated : 0y1
   +0x003 SkipPatchingUser32Forwarders : 0y0
   +0x003 IsPackagedProcess : 0y0
   +0x003 IsAppContainer   : 0y0
   +0x003 IsProtectedProcessLight : 0y0
   +0x003 IsLongPathAwareProcess : 0y0
   +0x004 Mutant           : 0xffffffff Void
   +0x008 ImageBaseAddress : 0x00350000 Void
   +0x00c Ldr              : 0x774b7340 _PEB_LDR_DATA
   +0x010 ProcessParameters : 0x009f6650 _RTL_USER_PROCESS_PARAMETERS
   +0x014 SubSystemData    : (null)
   +0x018 ProcessHeap      : 0x009f0000 Void
   +0x01c FastPebLock      : 0x774b7240 _RTL_CRITICAL_SECTION
   +0x020 AtlThunkSListPtr : (null)
   +0x024 IFEOKey          : (null)
   ...
Or if you’d like to look at the header of a heap:
0:003> dt _HEAP 0x009f0000
ntdll!_HEAP
   +0x000 Segment          : _HEAP_SEGMENT
   +0x000 Entry            : _HEAP_ENTRY
   +0x008 SegmentSignature : 0xffeeffee
   +0x00c SegmentFlags     : 2
   +0x010 SegmentListEntry : _LIST_ENTRY [ 0x9f00a4 - 0x9f00a4 ]
   +0x018 Heap             : 0x009f0000 _HEAP
   +0x01c BaseAddress      : 0x009f0000 Void
   +0x020 NumberOfPages    : 0xff
   +0x024 FirstEntry       : 0x009f04a8 _HEAP_ENTRY
   +0x028 LastValidEntry   : 0x00aef000 _HEAP_ENTRY
   +0x02c NumberOfUnCommittedPages : 0xe1
   +0x030 NumberOfUnCommittedRanges : 1
   +0x034 SegmentAllocatorBackTraceIndex : 0
   +0x036 Reserved         : 0
   +0x038 UCRSegmentList   : _LIST_ENTRY [ 0xa0dff0 - 0xa0dff0 ]
   +0x040 Flags            : 2
   +0x044 ForceFlags       : 0
   +0x048 CompatibilityFlags : 0
   +0x04c EncodeFlagMask   : 0x100000
   +0x050 Encoding         : _HEAP_ENTRY
   +0x058 Interceptor      : 0
   +0x05c VirtualMemoryThreshold : 0xfe00
   +0x060 Signature        : 0xeeffeeff
   +0x064 SegmentReserve   : 0x100000
   +0x068 SegmentCommit    : 0x2000
   +0x06c DeCommitFreeBlockThreshold : 0x800
   +0x070 DeCommitTotalFreeThreshold : 0x2000
   +0x074 TotalFreeSize    : 0x5ba
   +0x078 MaximumAllocationSize : 0x7ffdefff
   ...
In the PEB example above, I have used @$peb. That’s a pseudo-register. I’ll talk about them in a few moments.
Linked Lists
We can also use a d command to follow linked lists.
Segments in the NT heap, for instance, form a linked list
Well technically, it’s a doubly linked list… but single linked lists and doubly linked list usually begins with a flink (forward link, i.e. the address of the next element).
Let’s say we have a 32bit NT heap at 00690000. On Windows 11, the SegmentList Head is stored at offset 0xa4 in the header of the Heap:
0:002> dt _HEAP 00690000
ntdll!_HEAP
   +0x000 Segment          : _HEAP_SEGMENT
   +0x000 Entry            : _HEAP_ENTRY
   +0x008 SegmentSignature : 0xffeeffee
   +0x00c SegmentFlags     : 2
   +0x010 SegmentListEntry : _LIST_ENTRY [ 0xbb0010 - 0x6900a4 ]
	...
   +0x0a4 SegmentList      : _LIST_ENTRY [ 0x690010 - 0x3a50010 ]
	...
The primary command to display linked lists is dl
It walks a linked list and expects each node to being with a flink.
You’d simply run it against an address.
For example, with the ListHead at 006900a4 in the example above, we can run
0:002> dl 006900a4
006900a4  00690010 03a50010 00000000 00000000
00690010  00bb0010 006900a4 00690000 00690000
00bb0010  00cb0010 00690010 00690000 00bb0000
00cb0010  00eb0010 00bb0010 00690000 00cb0000
00eb0010  012b0010 00cb0010 00690000 00eb0000
012b0010  01ab0010 00eb0010 00690000 012b0000
01ab0010  02a80010 012b0010 00690000 01ab0000
02a80010  03a50010 01ab0010 00690000 02a80000
03a50010  006900a4 02a80010 00690000 03a50000
As you can see, the dl command prints out the entire linked list.
It starts at 006900a4 and finds 00690010.
At 00690010, it finds the address of the next one in the list: 00bb0010.
And so on.
006900a4 -> 00690010 -> 00bb0010 -> 00cb0010 -> 00eb0010 -> 012b0010 -> 01ab0010 -> 02a80010 -> 03a50010 -> 006900a4You can basically see the entire list, until it eventually finds an element in the list that has 006900a4 (the address of the ListHead), which indicates that this is the last element in the list.
You can now us a typed dump dt on each element, and it will print out the information in nicely annotated format:
0:002> dt _LIST_ENTRY 006900a4
ntdll!_LIST_ENTRY
 [ 0x690010 - 0x3a50010 ]
   +0x000 Flink            : 0x00690010 _LIST_ENTRY [ 0xbb0010 - 0x6900a4 ]
   +0x004 Blink            : 0x03a50010 _LIST_ENTRY [ 0x6900a4 - 0x2a80010 ]
0:002> dt _LIST_ENTRY 00690010
ntdll!_LIST_ENTRY
 [ 0xbb0010 - 0x6900a4 ]
   +0x000 Flink            : 0x00bb0010 _LIST_ENTRY [ 0xcb0010 - 0x690010 ]
   +0x004 Blink            : 0x006900a4 _LIST_ENTRY [ 0x690010 - 0x3a50010 ]
0:002> dt _LIST_ENTRY 00bb0010
ntdll!_LIST_ENTRY
 [ 0xcb0010 - 0x690010 ]
   +0x000 Flink            : 0x00cb0010 _LIST_ENTRY [ 0xeb0010 - 0xbb0010 ]
   +0x004 Blink            : 0x00690010 _LIST_ENTRY [ 0xbb0010 - 0x6900a4 ]
and so on.
Perfectly scriptable:
 r $t0 = poi(0x006900a4)
.for ( ; @$t0 != 0x006900a4 ; r $t0 = poi(@$t0) ) { dt _LIST_ENTRY @$t0 }
You could even go as far as getting the address of the default process heap itself from the peb and make this little script that gets the segments associated with the default heap:
x86-only:
r $t0 = poi(@$peb+0x18)
r $t1 = $t0+0xa4
r $t2 = poi($t1)
.for ( ; @$t2 != @$t1 ; r $t2 = poi(@$t2) ) { .printf "entry=%p\n", @$t2; dt _LIST_ENTRY @$t2 }
or, more generic, for both x86 and x64 (Windows 11 – and providing that the default process heap is NT and not Segment):
.printf "ptrsize=%d\n", @$ptrsize;
.if (@$ptrsize == 4) { r $t9 = 0x18; r $t8 = 0xA4 } .else { r $t9 = 0x30; r $t8 = 0x120 };
r $t0 = poi(@$peb + @$t9);
r $t1 = @$t0 + @$t8;
.printf "PEB=%p  ProcessHeap=%p  SegmentListHead=%p\n", @$peb, @$t0, @$t1;
dt _LIST_ENTRY @$t1;
r $t2 = poi(@$t1);
.for ( ; @$t2 != @$t1 ; r $t2 = poi(@$t2) ) { .printf "LIST_ENTRY=%p  Flink=%p  Blink=%p  Parent?=%p\n", @$t2, poi(@$t2), poi(@$t2+@$ptrsize), @$t2-0x10; }
output:
LIST_ENTRY=00690010  Flink=00bb0010  Blink=006900a4  Parent?=00690000
LIST_ENTRY=00bb0010  Flink=00cb0010  Blink=00690010  Parent?=00bb0000
LIST_ENTRY=00cb0010  Flink=00eb0010  Blink=00bb0010  Parent?=00cb0000
LIST_ENTRY=00eb0010  Flink=012b0010  Blink=00cb0010  Parent?=00eb0000
LIST_ENTRY=012b0010  Flink=01ab0010  Blink=00eb0010  Parent?=012b0000
LIST_ENTRY=01ab0010  Flink=02a80010  Blink=012b0010  Parent?=01ab0000
LIST_ENTRY=02a80010  Flink=03a50010  Blink=01ab0010  Parent?=02a80000
LIST_ENTRY=03a50010  Flink=006900a4  Blink=02a80010  Parent?=03a50000
If you wanted to dump the list for a heap other than the default, you can simply set $t0 to the address of that heap (instead of getting a value from the peb)
For example:
0:010> !heap
        Heap Address      NT/Segment Heap

    0000017463000000         Segment Heap
    0000017462270000              NT Heap
    0000017463400000         Segment Heap
    00000174623c0000              NT Heap
    0000017463600000         Segment Heap
.printf "ptrsize=%d\n", @$ptrsize;
.if (@$ptrsize == 4) { r $t9 = 0x18; r $t8 = 0xA4 } .else { r $t9 = 0x30; r $t8 = 0x120 };
r $t0 = 0000017462270000;
r $t1 = @$t0 + @$t8;
.printf "PEB=%p Heap=%p SegmentListHead=%p\n", @$peb, @$t0, @$t1;
dt _LIST_ENTRY @$t1;
r $t2 = poi(@$t1);
.for ( ; @$t2 != @$t1 ; r $t2 = poi(@$t2) ) { .printf "LIST_ENTRY=%p Flink=%p Blink=%p Parent?=%p\n", @$t2, poi(@$t2), poi(@$t2+@$ptrsize), @$t2-0x10; }Just one:
LIST_ENTRY=0000017462270018 Flink=0000017462270120 Blink=0000017462270120 Parent?=0000017462270008Searching memory (s)
When a debugger is attached to a process, we have the ability to query the entire process space. Debugger have search functionality that, unfortunately, is usually rather limited in terms of meaningful scope. You can most likely define the start and end position for the search, and identify what you’d like to find. But searches that require more intelligence will require some sort of scripting.
That’s why I very rarely use the built-in search.
Nevertheless, the s command allows you to search the virtual memory space from within WinDBG.
The basic syntax is one of the following variations:
s type startaddress L?distance searchpattern
s type startaddress endaddres searchpattern
Common types are:
- -a : search for an ascii string (raw sequence)
- -sa : search for an ascii string (null byte terminated)
- -u : search for a unicode string (raw sequence)
- -su : search for a unicode string (null bytes terminated)
- -b : search for a byte sequence
- -d : search for a dword value
- -q : search for a qword value
- -v : search for C++ vftables
A few examples:
0:003> s -a 0x00000000 L?0x7fffffff "AAAAAAAA"
77398581  41 41 41 41 41 41 41 41-42 42 42 42 42 42 42 42  AAAAAAAABBBBBBBB

0:003> s -d 0 0x7FFFFFF 0x008CFF40
003cfed4  008cff40 008c0000 003cff24 00ab17ff  @.......$.<.....

0:003> s -b 0 0x7FFFFFF CC CC CC CC
00ab100a  cc cc cc cc cc cc 55 8b-ec 8b 45 14 50 8b 4d 10  ......U...E.P.M.
00ab100b  cc cc cc cc cc 55 8b ec-8b 45 14 50 8b 4d 10 51  .....U...E.P.M.Q
00ab100c  cc cc cc cc 55 8b ec 8b-45 14 50 8b 4d 10 51 8b  ....U...E.P.M.Q.
00ab103a  cc cc cc cc cc cc 55 8b-ec 83 ec 08 8d 45 0c 89  ......U......E..
00ab103b  cc cc cc cc cc 55 8b ec-83 ec 08 8d 45 0c 89 45  .....U......E..E
00ab103c  cc cc cc cc 55 8b ec 83-ec 08 8d 45 0c 89 45 fc  ....U......E..E.
00ab107b  cc cc cc cc cc 55 8b ec-83 ec 10 8b 45 08 89 45  .....U......E..E
00ab107c  cc cc cc cc 55 8b ec 83-ec 10 8b 45 08 89 45 f8  ....U......E..E.
As explained, when performing searches, I tend to use a script that has a bit more filters and search capabilities.
For example, mona.py
Editing memory
Debugger provide the ability to edit memory and registers. I have a bit of a love-hate relationship with this, because the fact that a Debugger can change memory doesn’t mean your exploit will be able to do so. Debuggers will happily overrule access controls, so please be careful when you make changes in memory yourself.
Editing memory contents
There are 2 main ways to edit memory. You can use the command line, or you can edit memory directly in a memory view window.
From the WinDBG Command Line, you can use the e commands. You’ll have to specify the format/size of the change you’re going to make and the location, and of course you’ll need to provide the new value.
Let’s look at a few examples. I’ll use 0x12345678 (x86) or 0xda`12345678 (x64) as the placeholder for the location where you want to make a change in memory.
- eb location newvalue : change one byte at location: eb 0x12345678 41
- ed location newvalue : change a dword at location: eb 0x12345678 41424344
- eq location newvalue : change a qword at location: eb 0x12345678 4142434445464748
- ep location newvalue : change a pointer (architecture-aware) at location: ep 0x12345678 41424344 (x86) or ep 0xda`12345678 4142434445464748(x64)
- ea location newvalue : write an ansi string to location ea 0x12345678 “ABCDEFGH”
- eu location newvalue : write a unicode string to location eu 0x12345678 “ABCD” (this will write 0041004200430044)
- eza location newvalue : write a null-terminated ansi string to location ep 0x12345678 “ABCD” (a null byte will be appended automatically)
- ezu location newvalue : write a null-terminated unicode string to location ep 0x12345678 “ABC” (unicode, and a double null will be appended automatically)
Of course, you can also open a Memory view, go to the location you’re trying to edit, double-click in the memory view at that location and just start typing the new value.
If you notice that this doesn’t work in WinDBG Classic, you may want to check if ‘QuickEdit Mode’ is enabled.
Click ‘View’, choose ‘Options’ and verify that “QuickEdit Mode” is on.
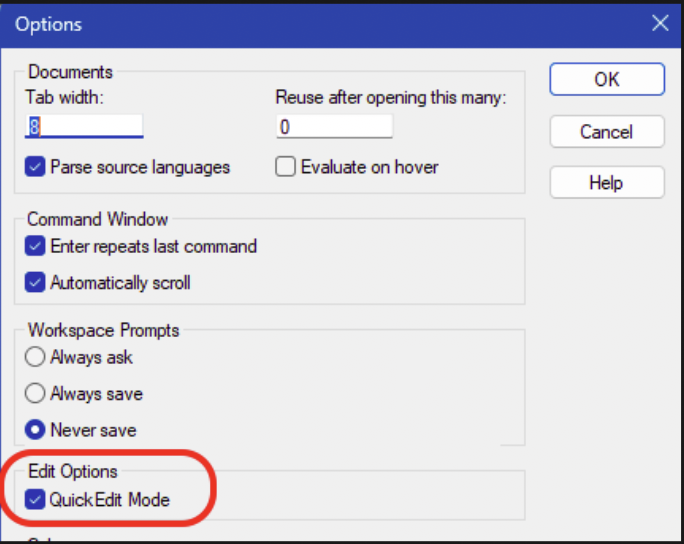
Fill memory
A variation on the concept of ‘editing’ memory, is ‘filling’ memory. The mechanism is based on an action that takes 3 variables: a location, a length and a pattern to write.
Basic syntax:
f location L?length pattern
The pattern can be one byte or multiple bytes (space separated). In the latter, the pattern will repeat until the total length becomes the length specified after L?.
Let’s look at a few examples. I’ll just fill memory at esp and then show the contents after each fill:
0:000> f esp L?4 41
Filled 0x4 bytes
0:000> dp esp L 8
00cff444  41414141 00b0a000 00fa6650 00000000
00cff454  00401db0 00cff444 fffffffe 00cff668

0:000> f esp L?4 41 42
Filled 0x4 bytes
0:000> dp esp L 8
00cff444  42414241 00b0a000 00fa6650 00000000
00cff454  00401db0 00cff444 fffffffe 00cff668
Editing registers
The r command will show the current registers (or at least a subset of all available registers).
0:000> r
eax=00000000 ebx=00000000 ecx=8e7f0000 edx=00000000 esi=011f6650 edi=00e96000
eip=77498218 esp=010ff3bc ebp=010ff3e8 iopl=0         nv up ei pl zr na pe nc
cs=0023  ss=002b  ds=002b  es=002b  fs=0053  gs=002b             efl=00000246
ntdll!LdrpDoDebuggerBreak+0x2b:
77498218 cc              int     3
r followed by a register will show the contents of that register
0:000> r @ecx
ecx=8e7f0000
0:000> r @dr0
dr0=00000000
You can change a register by assigning a value to it:
0:000> r @ecx=41414141
0:000> r
eax=00000000 ebx=00000000 ecx=41414141 edx=00000000 esi=011f6650 edi=00e96000
eip=77498218 esp=010ff3bc ebp=010ff3e8 iopl=0         nv up ei pl zr na pe nc
cs=0023  ss=002b  ds=002b  es=002b  fs=0053  gs=002b             efl=00000246
ntdll!LdrpDoDebuggerBreak+0x2b:
77498218 cc              int     3
mona.py
Installing mona.py in WinDBG Classic
Although mona.py was originally written for Immunity Debugger and heavily relies on Immunity Debugger’s API, I ended up porting that API to a WinDBG/PyKD-compatible library called windbglib. The combination PyKD, Python2 and windbglib allows us to run mona.py inside WinDBG and WinDBGX.
If you have used the CorelanVMInstall.ps1 script to install the debuggers, then mona.py and windbglib are already installed.
If not, please check out the installation instructions here: https://github.com/corelan/windbglib#windows-7-and-up-64bit-os-32bit-windbg
Make sure the default Python version on your system is Python 2.7 (v14 or higher), 32bit. If not, pykd/windbglib/mona will fail to work.
Running mona.py – WinDBG Classic
In WinDBG Classic, you have to load the pykd.pyd extension first, and then you can invoke mona.py through PyKD:
0:003> .load pykd.pyd
0:003> !py mona
Hold on...
[+] Command used:
!py mona.py
     'mona' - Exploit Development Swiss Army Knife - WinDBG (32bit)
     Plugin version : 2.0 r643
     Python version : 2.7.18 (v2.7.18:8d21aa21f2, Apr 20 2020, 13:19:08) [MSC v.1500 32 bit (Intel)]
     PyKD version 0.2.0.29
     Written by Corelan - https://www.corelan.be
     Project page : https://github.com/corelan/mona
     ...
It’s always a good idea to check for updates on a regular basis. If an update is available, mona.py
will update in-place.
0:003> !py mona up
Hold on...
[+] Command used:
!py mona.py up
[+] Version compare :
    Current Version : '2.0', Current Revision : 643
    Latest Version : '2.0', Latest Revision : 643
[+] You are running the latest version
[+] Locating windbglib path
[+] Checking if C:\Program Files (x86)\Windows Kits\10\Debuggers\x86\windbglib.py needs an update...
[+] Version compare :
    Current Version : '1.0', Current Revision : 151
    Latest Version : '1.0', Latest Revision : 151
[+] You are running the latest version

[+] This mona.py action took 0:00:03.198000
Log files
We can instruct WinDBG to write all output that you see in the Command view (including the commands that you’ve typed) to a log file.
If your WinDBG session is already open, you can open a new logfile with the .logopen command:
0:013> .logopen c:\logs\windbg.log
Opened log file 'c:\logs\windbg.log'
You also have the option to launch windbg with the -logo flag, followed by the full path to the log file that you want to create/use for the debugging session.
If you open a different logfile in the same session, it will close the open log file, if any.
When specifying the logfile path, make sure the path exists and is accessible:
0:013> .logopen c:\nonexisting\blah.log
Log file could not be opened
In any case, don’t forget to close the logfile again with .logclose at the end of your debugging session.
If you close WinDBG, and if it stil had a log file open, it might clear the logfile at the start of the next WinDBG session.
Pseudo-registers
The last topic I would like to discuss in this post, is pseudo-registers. They are like variables that you can use in your debugging session.
WinDBG has 2 types of pseudo-registers: read-only (with specific variable names) and read-write (with somewhat cryptic names).
The read-only pseudo-registers include:
- $ea : Effective address of last instruction that was executed
- $ea2 : Second effective address of last instruction that was executed
- $exp : Last expression that was evaluated
- $ra : Return address currently on the stack
- $ip : EIP on x86, RIP on x64
- $sp : ESP on x86, RSP on x64
- $bp : EBP on x86, RBP on x64
- $eventip : Instruction pointer at the moment the debug event occurred (may differ from current $ip)
- $previp : EIP at the time of the previous event (debugger break counts as an event)
- $retreg : Primary return value register (eax on x86)
- $retval : Function return value
- $p : Result of the last expression used by certain commands
- $bp(id) : Address of breakpoint identified by its ID (no space between $bp and (id))
- $dbgtime : Current time
- $exentry : AddressOfEntrypoint of first executable in process (bp $exentry)
- $peb : Address of the PEB
- $teb : Address of the TEB
- $proc : Current process
- $thread : Current thread
- $exceptioncode : Last exception code
- $exceptionaddress : Address where exception occurrred
- $ptrsize : A value indicating the architecture. 4 = 32bit, 8 = 64bit
You can use those variable names in all kind of commands (breakpoints, .printf statements, etc).
Just keep in mind that they are read-only, WinDBG makes sure they have the correct content.
The notations above are pseudo-register names. It is recomended, when you want to access their value, to prefix the name with @.
Without the @, WinDBG may interpret something like $peb as a symbol name or a literal. The @ fixes that.
In other words, $peb is the name of the variable, and @$peb is how you access its value.
For example:
dt _PEB @$pebGood.
WinDBG has 20 read-write user-definable pseudo-registers. You don’t get to choose the variable names, they are predefined as $t0, $t1, $t2, … up to $t19
On x86, you can store a 32bit value in the register. On x64, it’s a 64bit value.
You can use a register to hold on to a value, make calculations, keep track of things.
Let’s consider the following example:
Let’s say you want to keep track of how many times ntdll!RtlAllocateHeap is being used/called.
We’d put a breakpoint at the start of that function, and we can use one of the user-defined pseudo-registers to serve as a counter.
The breakpoint would then simply increment the value of the counter, and print the current value to the screen.
0:000> r @$t0=0
0:000> bp ntdll!RtlAllocateHeap "r @$t0=@$t0+1; .printf \"RtlAllocateHeap called %d times so far\\n\", @$t0;g"
0:000> g
RtlAllocateHeap called 1 times so far
RtlAllocateHeap called 2 times so far
RtlAllocateHeap called 3 times so far
RtlAllocateHeap called 4 times so far
RtlAllocateHeap called 5 times so far
RtlAllocateHeap called 6 times so far
RtlAllocateHeap called 7 times so far
As you can see in the above example, I have also prefixed the $t0 pseudo-register with the @. It would work without, but it might/would be slower, almost as if WinDBG is struggling a bit trying to determine what it actually is. With the @, it becomes crystal clear that we’re referring to the value of the pseudo-register.
Common WinDBG Commands
The following table shows a quick overview of the most important WinDBG commands:
| Command | Description |
|---|---|
| Execution control | |
| g | Continue running the process (go) – shortkey F5 |
| gN | Invoke exception handler |
| t / F11 | Step into (single trace) |
| p / F10 | Step over |
| tt | Trace (single step) until next RETN |
| pt | Step over until next RETN |
| tc | Trace until next CALL |
| pc | Step until next CALL |
| wt | Trace & watch – execute & show all CALLs |
| Breakpoints | |
| bp | Set a software breakpoint bp[id] address [passcount] “windbgcmd;windbgcmd;g” |
| ba | Set a hardware breakpoint ba e1 address / ba r2 address / ba w4 address |
| bm | Mass software breakpoints based on wildcard symbols |
| bl | Show all breakpoints |
| bc | Clear a breakpoint |
| be | Enable breakpoint |
| bd | Disable breakpoint |
| br | Renumber a breakpoint |
| j | Condition method #1 bp address “j (Condition) ‘OptionalCommands; gc’; ‘gc’;” |
| .if | Condition method #2 bp address “.if (Condition) {OptionalCommands; gc} .else {gc}” |
| Unassemble | |
| u | Unassemble forward |
| ub | Unassemble backward |
| uf | Unassemble function |
| Showing information | |
| r | Show registers, or set a register to a value |
| d | Display memory |
| db | Display memory (bytes) |
| dp | Display memory (pointers) |
| dps | Display memory (pointers + symbol name) |
| dt | Typed display |
| dl | Display linked list |
| .printf format specifiers | |
| %p | Pointer |
| %x / %X | hex value (without leading null padding) – lowercase / uppercase |
| %I64x | 64bit hex value (without leading null padding) – avoids truncation |
| %y | Pointer + symbol name |
| %ly | Pointer + symbol name (safe for 64bit) |
| %d | Decimal |
| %I64d | 64bit Decimal |
| %c | Character |
| %N | Number with commas |
| %f | Float |
| %e | Scientific |
| %g | Compact |
| %ma | ASCII C string (null terminated) |
| %mu | WIDE C string (null terminated) |
| %msa | ANSI_STRING* |
| %msu | UNICODE_STRING** |
| Various | |
| lm | Show loaded modules (and symbol file, if present/downloaded) |
| ? | MASM Expression evaluator ?esp / ?module / ?address-module / ?@eax |
| x | Search (examine) symbols x module!*wildcard* |
| ; | Command separator |
| poi | Dereference ?poi(@esp) |
| Alt+Del | Interrupt WinDBG is it’s busy |
Resources
Here are some other resources on WinDBG that are worth checking out:
- https://learn.microsoft.com/en-us/windows-hardware/drivers/debuggercmds/windbg-overview
- https://codemachine.com/articles/windbg_quickstart.html
If you have other quality resources on WinDBG, feel free to let me know, I’ll gladly add them to the list here.
Key Takeaways & learnings
- Debugging fluency is essential. practice attaching, stepping, inspecting, and taking control to lean on the tool instead of getting crushed by the tool.
- Prefer attaching over launching to avoid NtGlobalFlag changes (heap validation, layout shifts) that break exploits or trigger anti-debug.
- Symbols provide insigts, but are a luxury. Configure the Microsoft symbol server early for readable function/struct names instead of raw addresses.
- ASLR makes absolute addresses unreliable → always use symbolic breakpoints (bp ntdll!RtlAllocateHeap) or module-relative (ntdll+0x3f8a0) for resilience.
- Breakpoints are versatile: use them for stopping or silent logging (commands + gc to continue).
- Pseudo-registers are your variables: @ prefix for system values (e.g., @$peb), $t0–$t19 for counters/state in scripts/conditional bps.
- WinDbg’s rough GUI is worth customizing (workspaces/layouts) — fight the interface once, then focus on the target.
- Extend built-in limits with tools like mona.py when needed (better search, pattern creation).
Outro
At its core, debugging is about building understanding.
Every time you step through code, inspect memory, or analyze a crash, you’re training your intuition about how software behaves under the hood. Over time, that intuition becomes one of your most valuable assets.
WinDbg might feel rough at first, but stick with it. It gives you the tools to build that understanding, even if it takes a bit of effort to get comfortable with it. The more fluent you become, the closer you get to thinking in instructions instead of assumptions. And that’s where things start to click.