
Original text by eversinc33
The article explains a practical workflow for unpacking a Windows kernel driver protected with VMProtect and preparing it for reverse engineering. The author analyzes an anti-cheat driver (KSophon_x64.sys) protected by VMProtect v2–3 and demonstrates how to bypass its protection mechanisms to restore a usable binary for analysis. The main challenge comes from VMProtect’s Import Address Table (IAT) protection, which removes visible imports and replaces calls with indirect references, making static analysis difficult. To recover the original functionality, the researcher performs dynamic analysis using kernel debugging with WinDbg and loads the driver as a boot driver inside a virtual machine. By setting breakpoints at the module load event and at the DriverEntry function, the debugger can pause execution after VMProtect’s initialization routines finish and the IAT is reconstructed in memory. At that moment, the driver image is dumped from memory, preserving the decrypted state. The article also describes reconstructing imports by calculating offsets relative to ntoskrnl and restoring the IAT with a small Unicorn-based emulation script. The result is a clean driver binary suitable for further reverse engineering and vulnerability research.
Unpacking VMProtect is rather straightforward and there are many ways in which it is documented for userland processes – for kernel drivers however, even less for boot drivers, there is not that much documentation. I recently had to unpack one such driver and wanted to document it here as a simple guide for anyone else that has to unpack VMP for a driver. While unpacking is simple, restoring the Import Address Table (IAT) is a bit harder – but we will solve that with some emulation using a Unicorn script below. We will not devirtualize VMProtect – luckily, this driver was not virtualized (^-^).
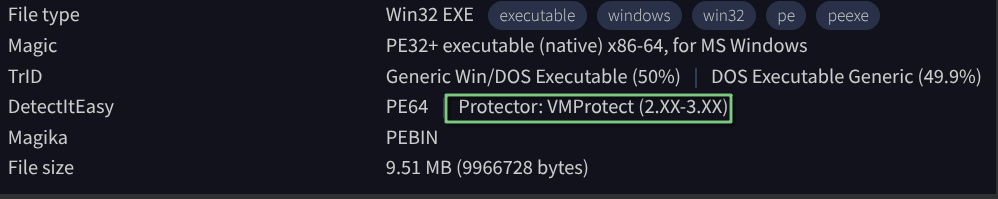
The driver I unpack here is a certain Anti-Cheat driver, called KSophon_x64.sys (2005e9afa51b7918dd1d0143d181641529c488e945fc6bfe1db48805aabdedb3). The driver is protected using VMProtect v2-3, although I am not exactly sure which version. The process may thus be different for you, especially regarding IAT restoration.
I am not going to go into the setup for Kernel debugging, please refer to any public guide or ask your LLM. It’s very simple, and involves running WinDbg on one machine and configuring remote debugging on the other.
Inspecting the driver
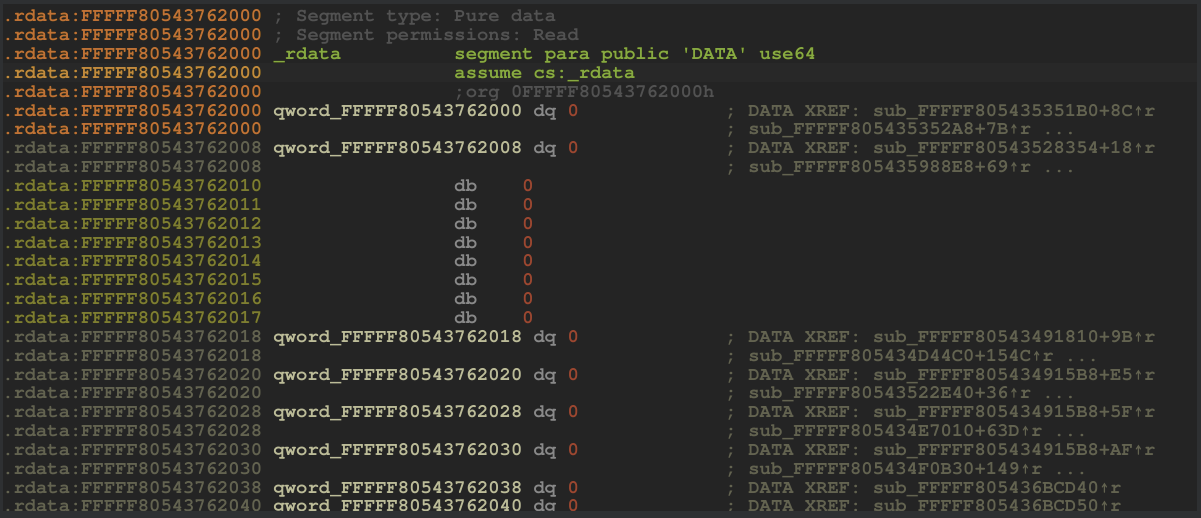
Why do we even want to unpack our driver? Well, upon looking at the file in IDA, we can see that there are no imports at all and all calls are indirect calls that reference uninitialized memory:
This is VMProtect’s IAT protection. However, once our driver runs, the driver must restore its own IAT – which is what we want it to do, to then dump it to a file and be able to analyze its functionality. To do this, we need to of course run it:
Unpacking the driver
Since we are dealing with a boot driver, we wil specify this on creating the service for it in our VM:
sc.exe create ksophon_x64 binPath= "C:\Windows\system32\drivers\ksophon_x64.sys" start= boot type= kernelAfterwards, we start WinDbg on our debugger machine, set Break on connection and restart our debuggee VM:
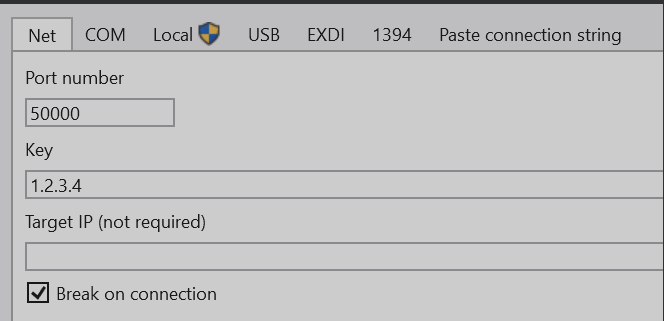
WinDbg will then break on boot.
Our goal is to break on the DriverEntry function, the entrypoint of our module. We can first register an exception on load of our target module. This breakpoint will trigger when the driver is mapped into memory, but no initialization code was ran yet:
sxe ld:ksophon_x64.sysWhen this breakpoint hits, the image is loaded, so we can now dump its headers with !dh. Of course we could do this statically, but we are already in WinDbg anyway.
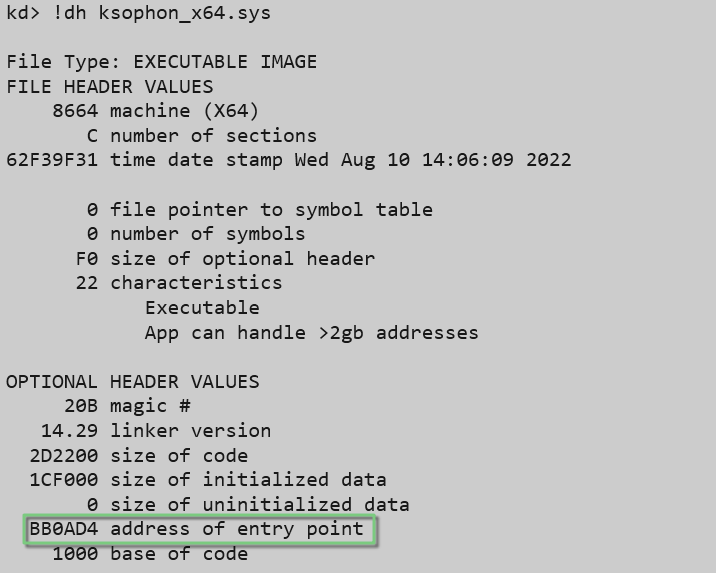
Here, we note down the address of entry point and set a breakpoint on it using bp <modulename>+<addr_of_entry>.
When this breakpoint is then hit, we can dump the call stack with k and set another breakpoint on the return address of the entrypoint – this is when all initialization code of VMProtect, as well as our driver, has been executed – which means the IAT should be decrypted:
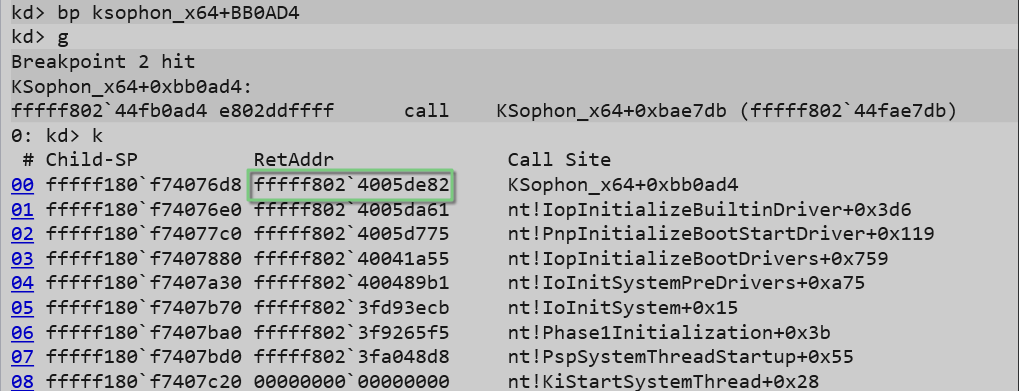
Using .writemem, we can now dump the driver image from memory (Setting a breakpoint this early also has the benefit that the INIT section is still intact – it will only later be destroyed by MiFreeInitializationCode).
.writemem C:\temp\dumped.sys START START+SIZEWe also note down the address of ntoskrnl.exe/nt using lm k – we will need this in a second, as all entries of the IAT will be offsets relative to that address.
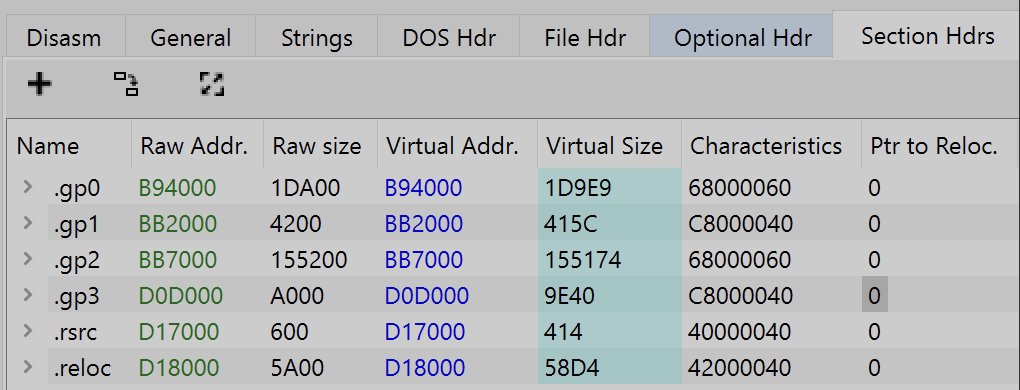
Since we have dumped the driver in a mapped layout from memory, we need to fix the image so that IDA correctly parses the sections. We can do this by setting the RAW_ADDR of each section (essentially the file offset) to the corresponding VIRTUAL_ADDR that our module was mapped to, so that they are synchronized. I use PeBear for this :
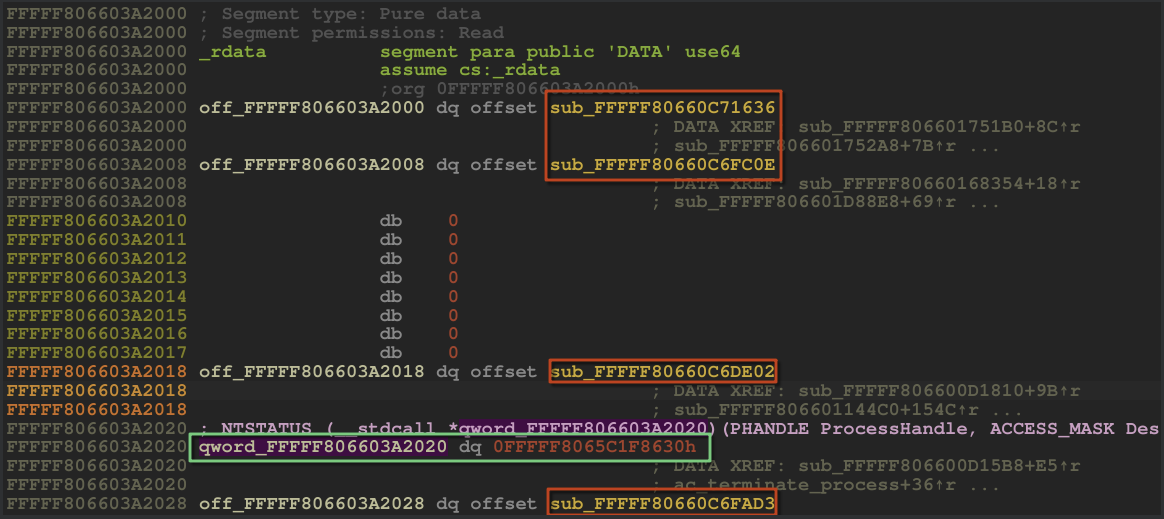
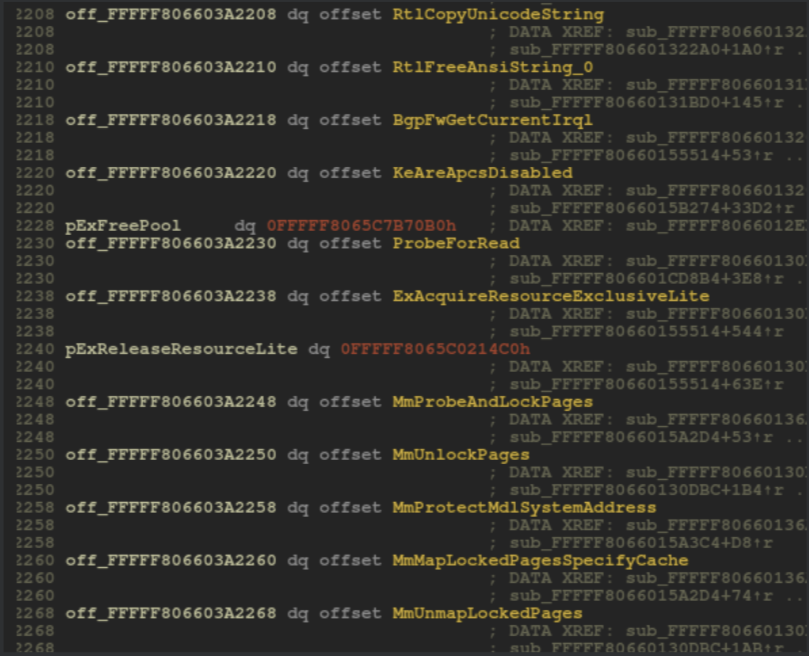
Before, our IAT looked like this:
With the driver dumped from memory, the IAT is now restored and intact. However, we have two different types of entries: The green ones directly reference functions in ntoskrnl (by address, which is why we noted down the base address earlier) – the red ones are trampoline functions, which calculate the address of a specific function.
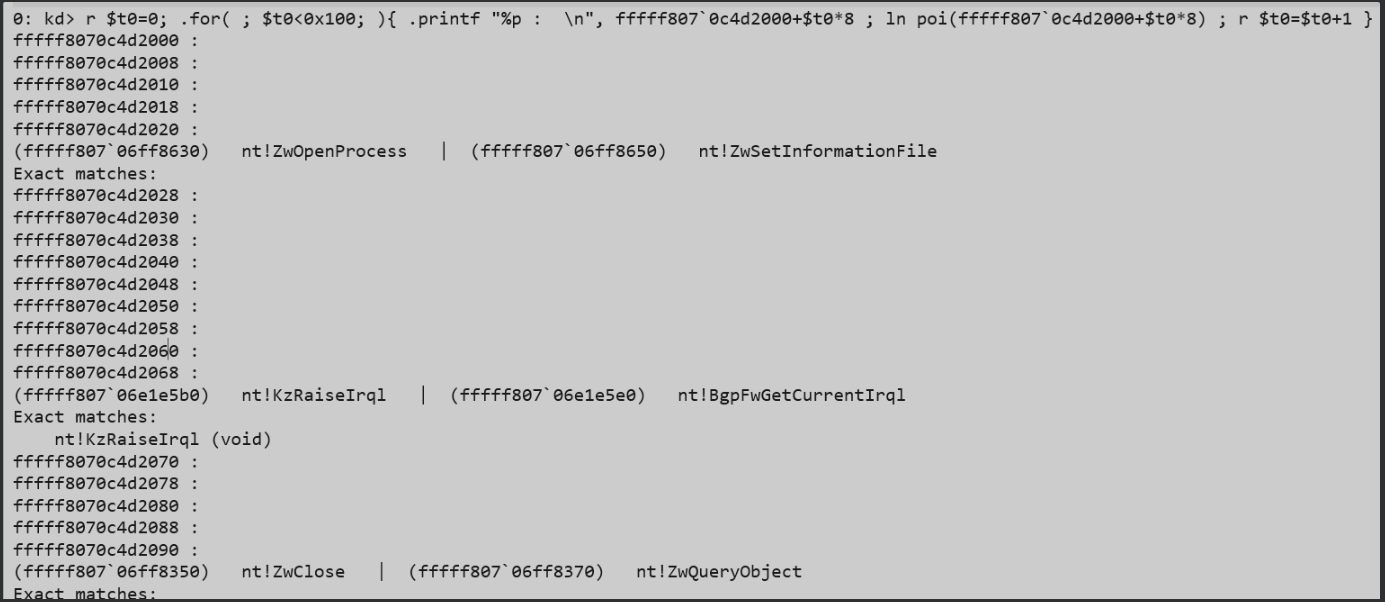
This becomes apparent if we dump the IAT in WinDbg using ln (list nearest symbol) on each of its pointers. The ones that resolve to functions are the direct references I colored green above – all others are not directly readable:
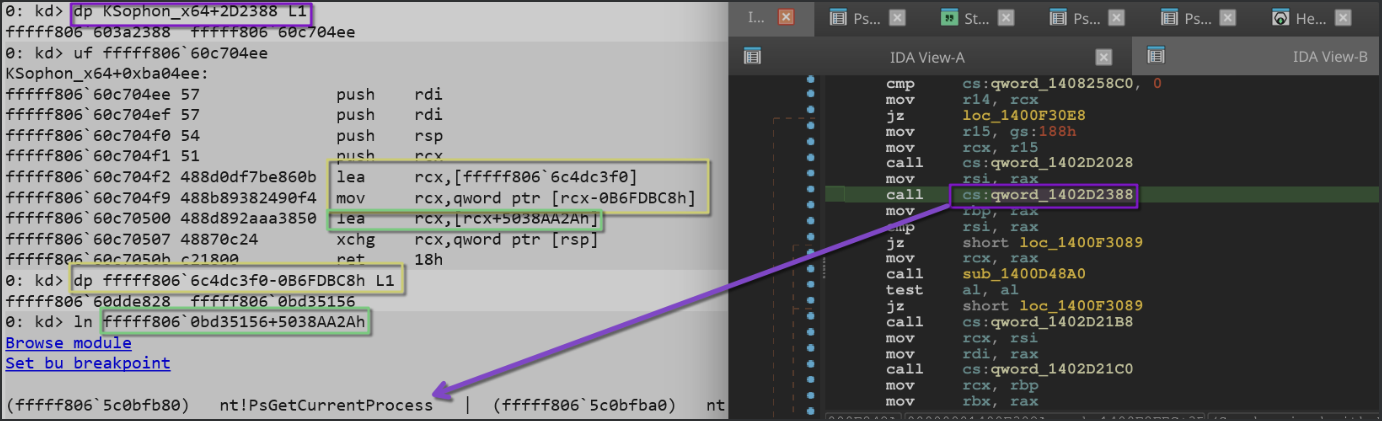
We can inspect one such trampoline function in ẀinDbg and resolve the function its pointing to by manually calculating it.
The entry qword_1402D2388 point to a function which we unassemble in WinDbg using uf. The function:
- Loads an immediate (
fffff806 6c4dc3f0) - Substracts
0B6FDBC8, which results in an address of a pointer in our driver - Adds
5038AA2Ato the value pointed to by that pointer
If we then inspect the nearest symbol of that result, we see that this entry actually points to PsGetCurrentProcess:
All trampolines follow the same logic – and since they are small, position independent code, we can simply emulate them with Unicorn, a python library for code emulation.
The below script implements the following:
- Loads our dumped driver
- Loops over its
.rdatasection and checks if the entry is a function - If it is a pointer to a function in the drivers
.textsection (a trampoline function), it emulates the function - Once
xchgis hit (the first instruction after calculations are done), it dumps the content ofrcx, which holds our calculated address - Finally, for convenience, it displays the address based on its offset to
ntoskrnl
from unicorn import *
from unicorn.x86_const import *

DUMP_PATH = r"./ksophon_full.bin"

RUNTIME_BASE = 0xFFFFF80583A90000
RUNTIME_END  = 0xFFFFF805847AE000
RUNTIME_SIZE = RUNTIME_END - RUNTIME_BASE

RDATA_RVA    = 0x2D2000
RDATA_SIZE   = 0x95A00
RDATA_RAW    = 0x2D0A00      # file offset inside dump

# ntoskrnl.exe base address
NTOSKRNL_BASE = 0xFFFFF8057FC00000 # we noted this down earlier

# Unicorn has issues with kernel-mode addresses above certain range
EMU_BASE = 0x140000000  # Arbitrary user-mode address for emulation

def read_qword_from_dump(dump, file_offset):
    b = dump[file_offset:file_offset+8]
    return int.from_bytes(b, "little")

def emulate_function_at(runtime_ea, dump):

    # Verify the address is within bounds
    if not (RUNTIME_BASE <= runtime_ea < RUNTIME_END):
        print(f"[!] Address {hex(runtime_ea)} is outside runtime range!")
        return

    emu = Uc(UC_ARCH_X86, UC_MODE_64)

    # Ensure size is page-aligned (4KB pages)
    PAGE_SIZE = 0x1000
    aligned_size = (RUNTIME_SIZE + PAGE_SIZE - 1) & ~(PAGE_SIZE - 1)

    # Map at lower address for emulation
    emu.mem_map(EMU_BASE, aligned_size)
    emu.mem_write(EMU_BASE, dump)

    # Convert runtime address to emulation address
    emu_ea = EMU_BASE + (runtime_ea - RUNTIME_BASE)

    emu.reg_write(UC_X86_REG_RSP, EMU_BASE + RUNTIME_SIZE - 0x1000)
    emu.reg_write(UC_X86_REG_RBP, 0)
    emu.reg_write(UC_X86_REG_RBX, 0)
    emu.reg_write(UC_X86_REG_RCX, 0)

    def hook_ins(uc, ip, size, user):
        b = uc.mem_read(ip, size)
        # detect "xchg rcx, [rsp+imm]"
        if b[0]  0x48 and b[1]  0x87:
            rcx = uc.reg_read(UC_X86_REG_RCX)
            offset = rcx - NTOSKRNL_BASE
            print(f"nt+{hex(offset)}")
            raise Exception("stop")

    def hook_mem_invalid(uc, access, address, size, value, user_data):
        return False

    emu.hook_add(UC_HOOK_CODE, hook_ins)
    emu.hook_add(UC_HOOK_MEM_INVALID, hook_mem_invalid)

    try:
        emu.emu_start(emu_ea, EMU_BASE + RUNTIME_SIZE)
    except UcError:
        pass  # Ignore emulation errors
    except Exception as e:
        if str(e) != "stop":
            raise

def main():
    dump = open(DUMP_PATH, "rb").read()

    count = 224 # iat size

    for i in range(count):
        file_off = 0x2D2000 + (i * 8)
        target = read_qword_from_dump(dump, file_off)

        # Only emulate if pointer points inside executable .text section
        if RUNTIME_BASE <= target < RUNTIME_END:
            #print(f"{i},", end="") # {hex(target)}
            emulate_function_at(target, dump)
        else:
            print(f"{hex(target)}")

if __name__  "__main__":
    main()
The result looks like this:
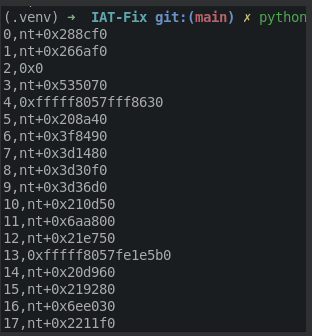
Now, these results can either be resolved to function names with ln in WinDbg, using a loop like above, or using one of the pdb parsing libraries. I could not get one of those to work, so I just ran the lookup of each entry through WinDbg.
Afterwards, we can start renaming our IAT entries (or script it with the python api), and we get a clean IAT:
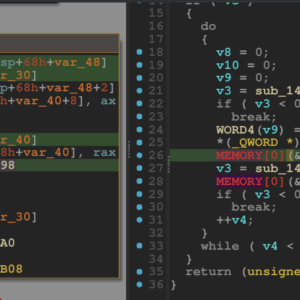
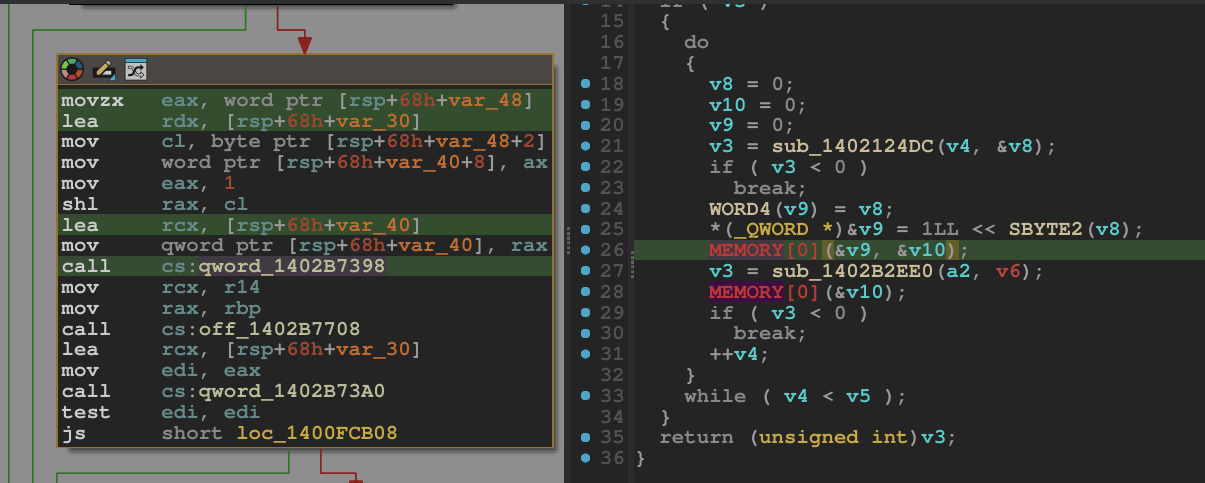
Now the code is finally readable, as can be seen in the below. On the left, a decompilation with a restored IAT, on the right without:
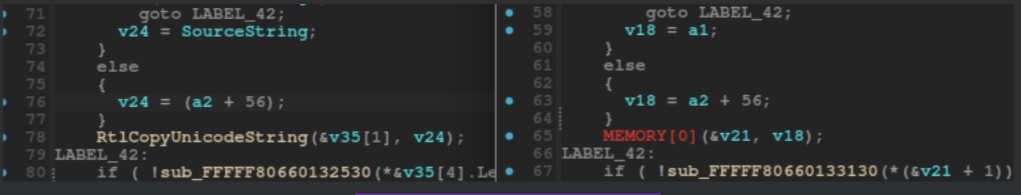
From here on, static analysis of the driver can be properly started.
Wrapping up
Unpacking VMProtect, if not virtualized, is simply a matter of setting the right breakpoints and navigating the Windows kernel. While restoring the IAT involves some tricks, with the power of emulation and the Unicorn library that hurdle can be overcome as well.
I hope you learned a thing or two.
Happy Hacking!
Note: This tutorial is also available on UnknownCheats